Data Series 917
|
Error AnalysisInterferometric Swath The stated horizontal accuracy of the OmniSTAR HP navigation subscription used during swath bathymetry acquisition is +/- 10 centimeters (cm) horizontally and +/-15 cm vertically. The Coda Octopus F190R IMU integrates the OmniSTAR HP position with motion, measures vessel velocity (+/- 0.014 meters/second (m/s)), roll (+/- 0.025 degrees), pitch(+/- 0.025 degrees), heading (1 m baseline 0.1 degrees), and heave (5 cm per meter of depth) (table 3). The vertical accuracy for the SWATHplus-H system varies with depth and across track range. At 57 m the SWATHplus-Hit is accurate to 10 cm vertically (table 2). Sound velocity captured in real-time at the transducer head was collected by a Valeport Mini SVS with a stated maximum error of +/- 0.017 m/s (table 3). Sound velocity profile cast data tables were also applied to the swath data based on time, water depth, and spatial representation during the survey. The SVP data were captured with a Valeport Mini SVP with stated accuracy of +/- 0.02 m/s (table 4). Vertical Transformation In addition to positional accuracies inherent for different datums (for example, NAD83, σ = 2.0 cm; NAVD88, σ = 5.0 cm; Mean Lower Low Water, MLLW, σ = 1.6 cm), error is introduced every time the data are transformed between datums. The transformation from ellipsoid height (ITRF05) to orthometric height (NAVD88) is σ = 7.0 cm, and the maximum cumulative uncertainty (quantified by standard deviation) introduced when transforming from ellipsoid height to orthometric height to a tidal datum (for example, MLLW) is 17.1 cm for eastern Louisiana (http://vdatum.noaa.gov/docs/est_uncertainties.html).
A comparison of the DEM versus the sounding (x,y,z point data) was plotted to evaluate how well the DEM represented the original sounding data quantitatively and spatially. The comparison was performed using the error results from the cross-validation report produced by the radial basis function process. The validation reports the measured value which is the x, y, z point data, the predicted value from the surface, and error value, which is the difference between the two values. From this data the root mean square error (rms) was calculated using the following equation:
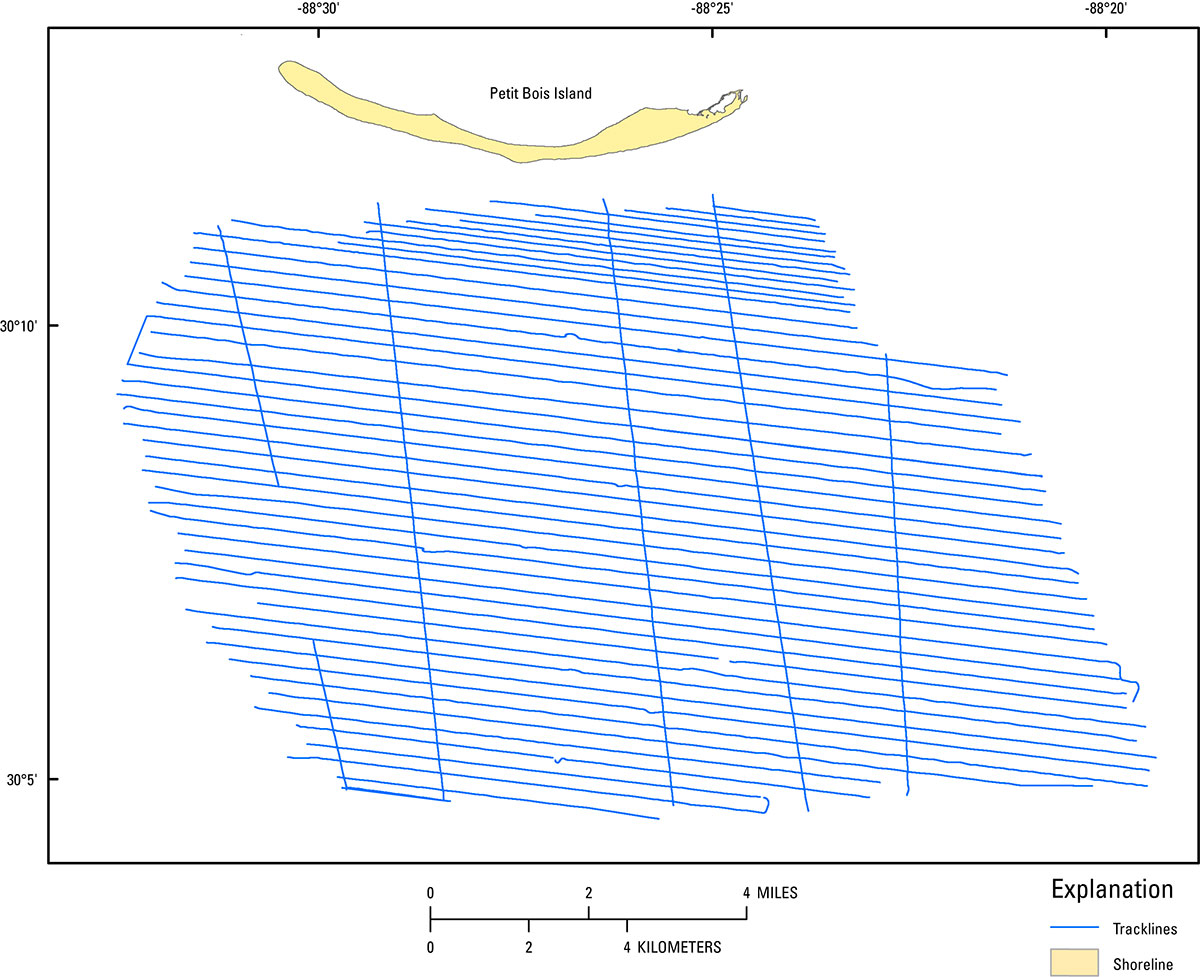
The difference between the DEM and the original sounding values were plotted, color coded, and placed against the backdrop of the DEM. This display provided a visual aspect of the spatial representation of error (fig. 8). There are a total of 11,761,696 samples and the root mean square error of all points is 0.186 m. The root mean square error of 91 percent of all points is 0.xxxx m. The difference between the point dataset and the predicted DEM values were color coded in order to visually articulate differences (fig. 8). This comparison demonstrates how well the model surface represents the original sounding and sample data. The interpolated DEM resolution was constrained by a 50-m cell size and the distance between tracklines was generally in excess of 300 m (fig. 2). The sounding distribution compared to the DEM resolution influences how well the DEM represents the data. In this example there may be hundreds of samples in a 50 x 50-m cell; however, all of those samples are only represented on the surface by one value, typically the mean. Therefore, in cases where terrain slope is high the gridding formula mutes the actual variability in the sample data. This sacrifice is necessary when creating continuous surfaces over bathymetric datasets where trackline spacing did not allow for overlap. Finlayson and others (2011), Fregoso and others (2008), and Foxgrover and others (2004) also reported difficulty with gridding over steep slopes. Percent coverage of swath sample data relative to the elevation model area is approximately 74%, encompassing 151.23 km2.
|

![]() U.S. Department of the Interior |
U.S. Geological Survey
U.S. Department of the Interior |
U.S. Geological Survey
URL: http://pubsdata.usgs.gov/pubs/ds/0917/ds917_error.html
Page Contact Information: GS Pubs Web Contact
Page Last Modified: Monday, 28-Nov-2016 20:36:15 EST


