Data Series 1032
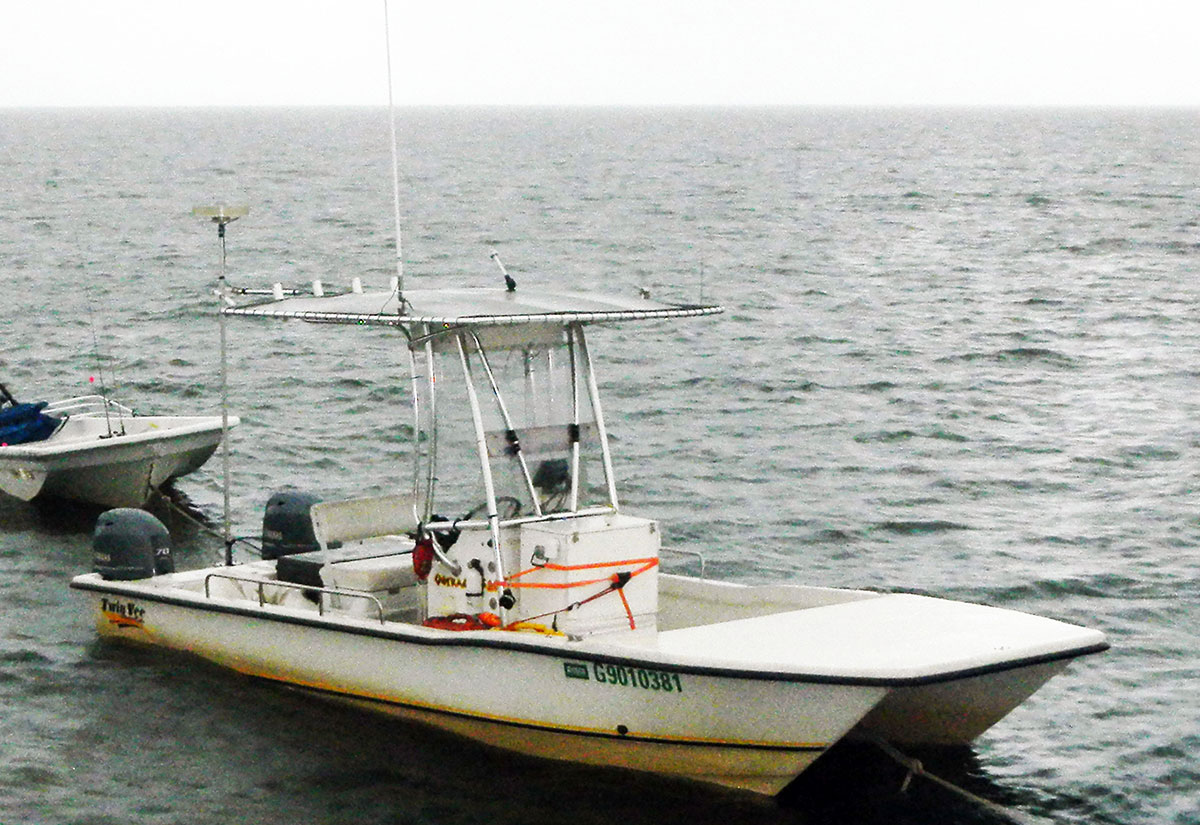
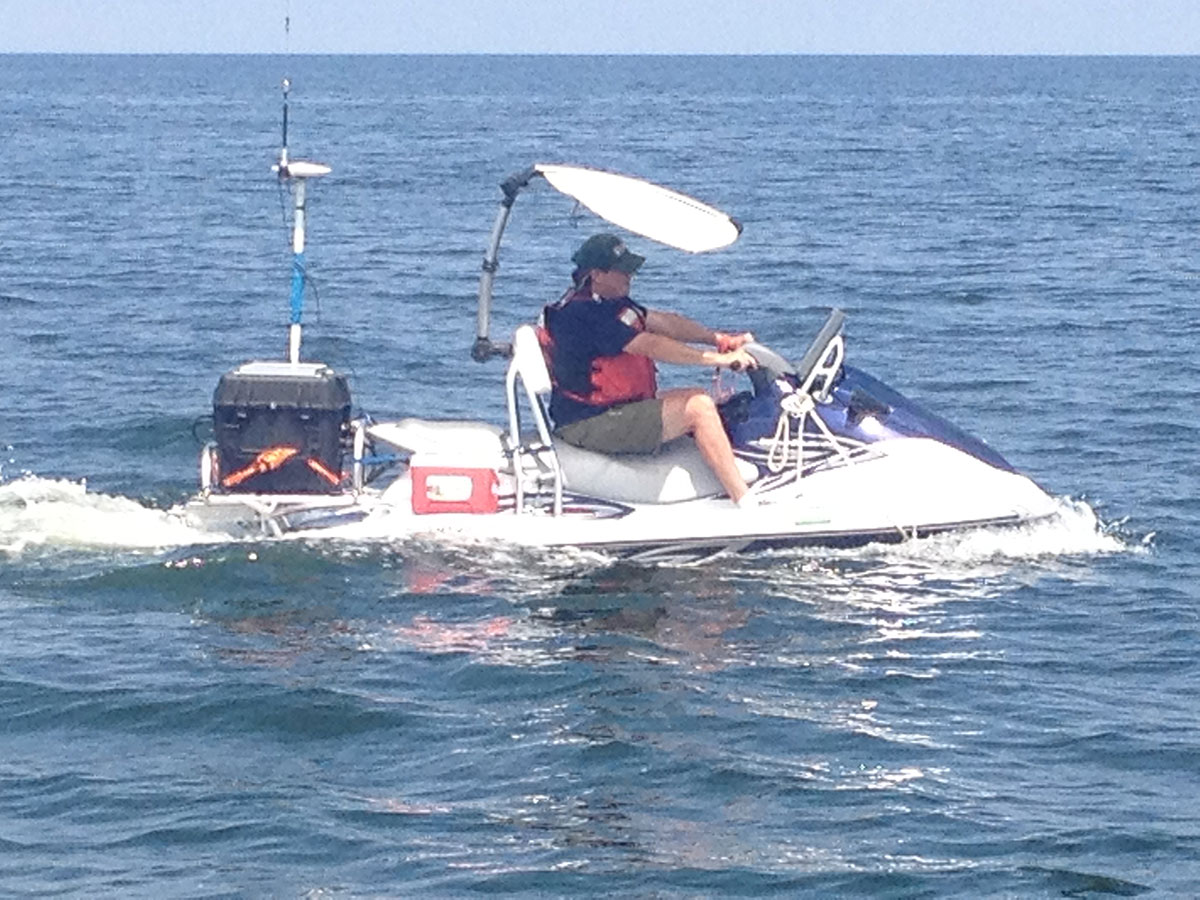
| Survey Overview and Data AcquisitionGeophysical survey data were collected during the summer of 2013 during two cruises each using multiple vessels. The first cruise occurred from July 5 to July 19 (13BIM02, 13BIM03, and 13BIM04) and the second from August 22 to September 1 (13BIM07 and 13BIM08). Approximately 429 line-km of single-beam bathymetry (SBB) (figs. 2 and 8) data were collected aboard two platforms, the 20-foot (ft) R/V Jabba Jaw (fig. 6) (13BIM03, 13BIM08) and the R/V Shark (13BIM04), a 12-ft Yamaha Personal Watercraft (PWC) specifically outfitted for SBB acquisition (fig. 7). Tracklines (246 lines) were primarily oriented perpendicular to shore and spaced approximately 100 meters (m) apart (figs. 2 and 8, table 1). Additional single-beam data were also acquired along six lines spaced approximately 1 km apart extending 6 km offshore on both the gulf and sound sides of the islands. These lines were designed to reoccupy previously collected single-beam bathymetric survey lines allowing for comparison of bathymetric profiles from multiple surveys independent of larger-scale mapping efforts. 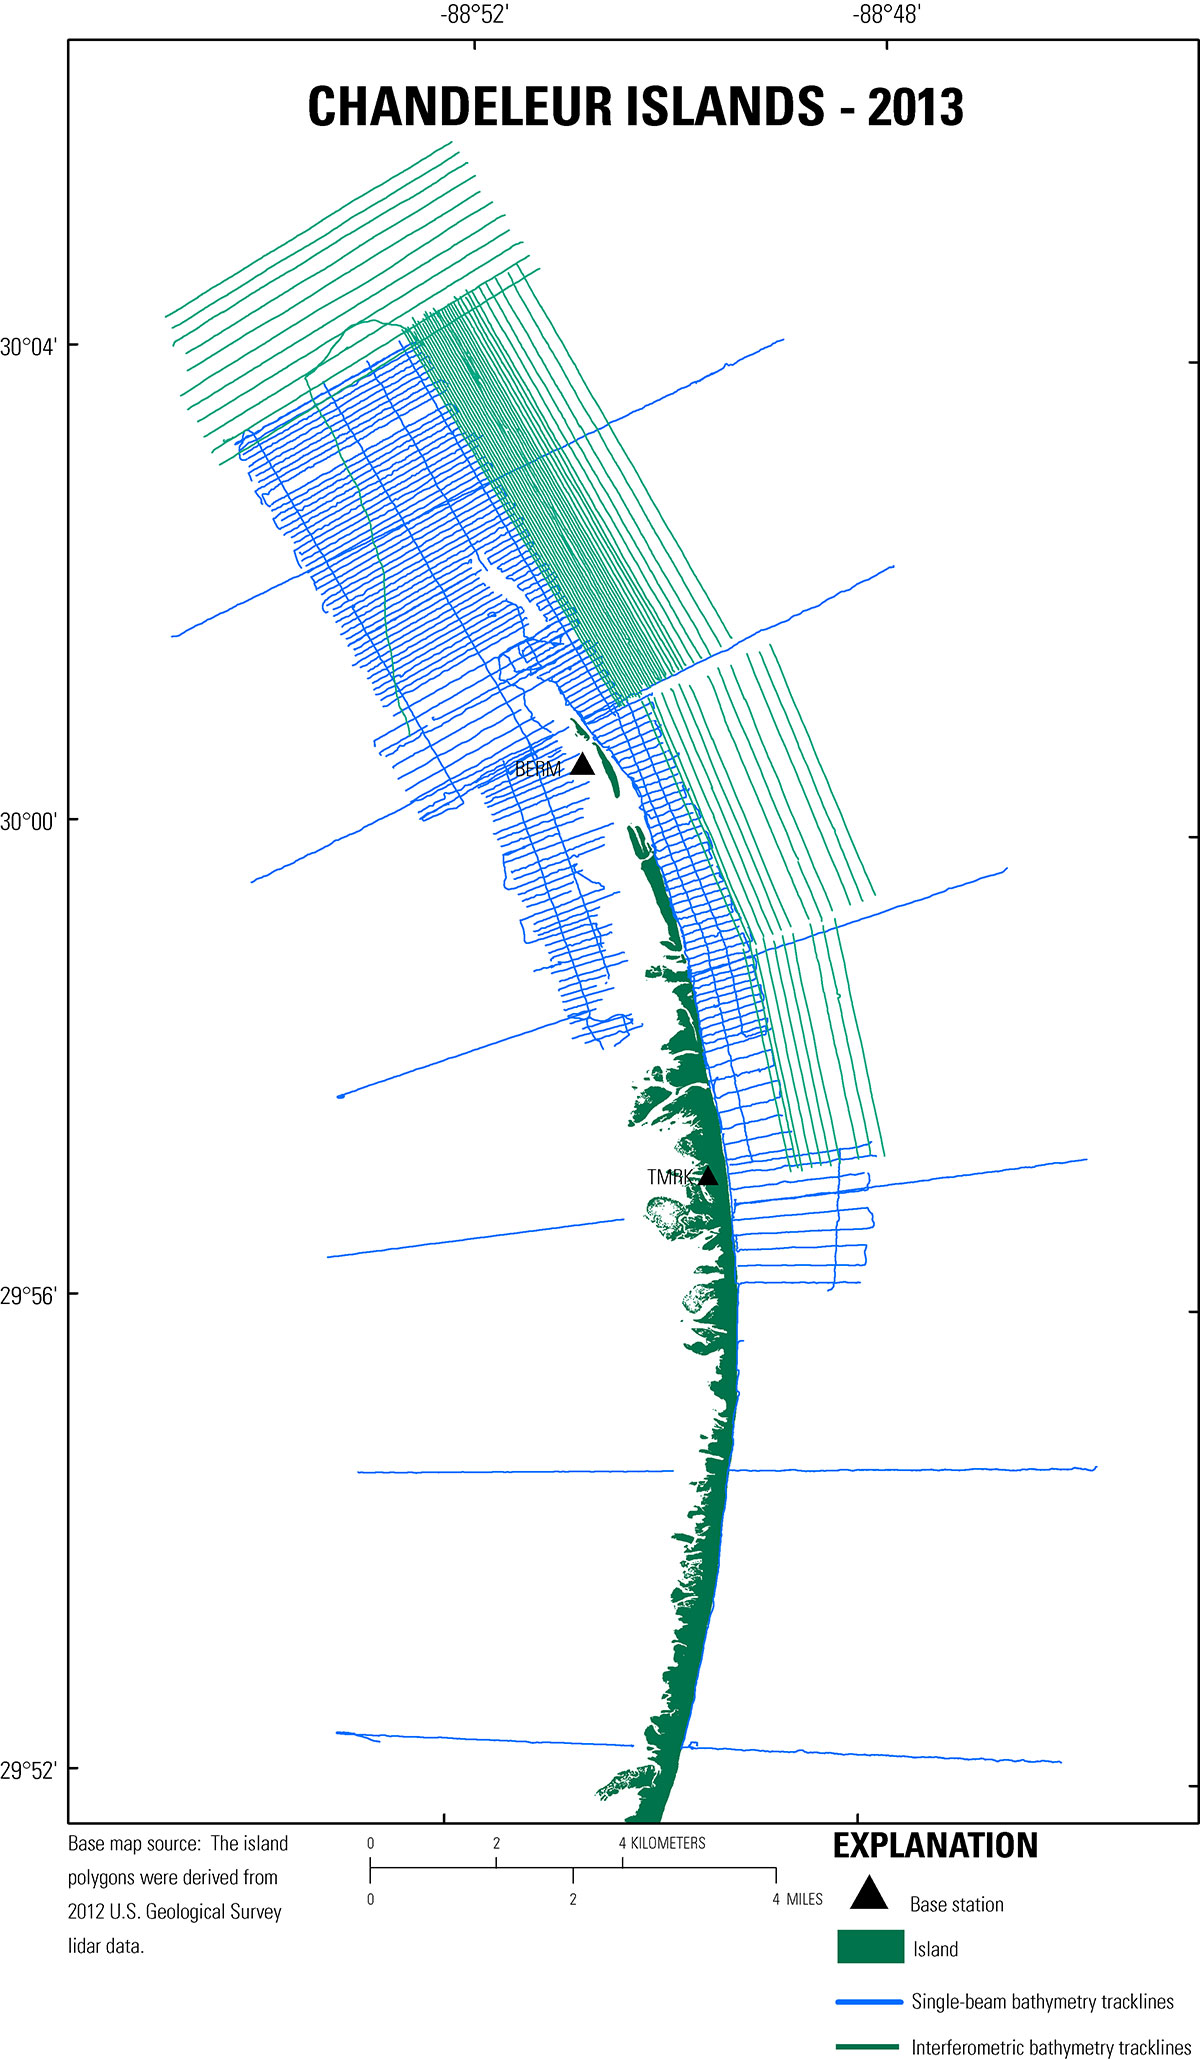 Figure 2. Trackline map overview for the 2013 geophysical surveys in the northern Chandeleur Islands, Louisiana. Blue tracklines represent single-beam bathymetry. Green tracklines represent interferometric swath bathymetry. The island area extent is derived from U.S. Geological Survey light detection and ranging (lidar) collected in 2012 (Guy and others, 2014). [Click to enlarge] Interferometric swath bathymetry (IFB) and seismic data (13BIM02 and 13BIM07) were collected from the 25-ft R/V Sallenger (fig. 9). Approximately 375 line-km of data (figs. 2 and 10) were collected utilizing an integrated suite of geophysical instruments capable of mapping the nearshore environment around the island, including interferometric swath sonar that provided swath bathymetry, and a high-resolution chirp subbottom profiler that imaged the shallow subbottom (Forde and others, 2014). Swath bathymetry, and chirp tracklines (98 lines) were generally shoreline parallel and line spacing varied from 50 m to 250 m, depending on water depth (figs. 2 and 10; table 1). Tie lines, or tracklines perpendicular or oblique to shoreline orientation, were also surveyed as a check on bathymetric soundings and to provide dip or apparent dip lines for the chirp profiles.
Table 1. Summary of the field activity numbers (FAN) listing data type collected, total trackline count, and total trackline length surveyed. Measurements are expressed in kilometers (km).
Data AcquisitionSingle-Beam Bathymetry | Swath BathymetrySingle-Beam BathymetryNavigationDifferential Global Positioning System (DGPS) data was obtained for the nearshore SBB surveys using two land based GPS base stations. The southern base location occupied a previously installed USGS benchmark (TMRK), located on a wide sand flat on the sound side of the island (figs. 2 and 3). The northern base station (BERM) location was approximately 6.5 km north of TMRK on an emergent island remnant. BERM was a temporary benchmark installed by USGS for bathymetry surveys during the summer of 2012. Between the 2012 to 2013 survey seasons, Hurricane Isaac impacted the Chandeleur Islands and eroded a significant portion of the remnant island where BERM was located, rendering it unusable for base station occupation. A second temporary benchmark BRM2 was installed on the same island remnant for the 2013 surveys (figs. 2, 4, and 5). For the August surveys, RTK was not used due to time constraints and navigation data was post processed. The same benchmarks were used (TMRK and BRM2). The base receivers and the rover receiver recorded their positions concurrently at 1-second (s) intervals throughout the survey. GPS data was acquired and processed in the World Geodetic Datum of 1984 (WGS84) (G1150). HYPACK version 10, a marine surveying, positioning, and navigation software package, managed the planned-transect information and provided real-time navigation and instrumentation-status information to the boat operator. 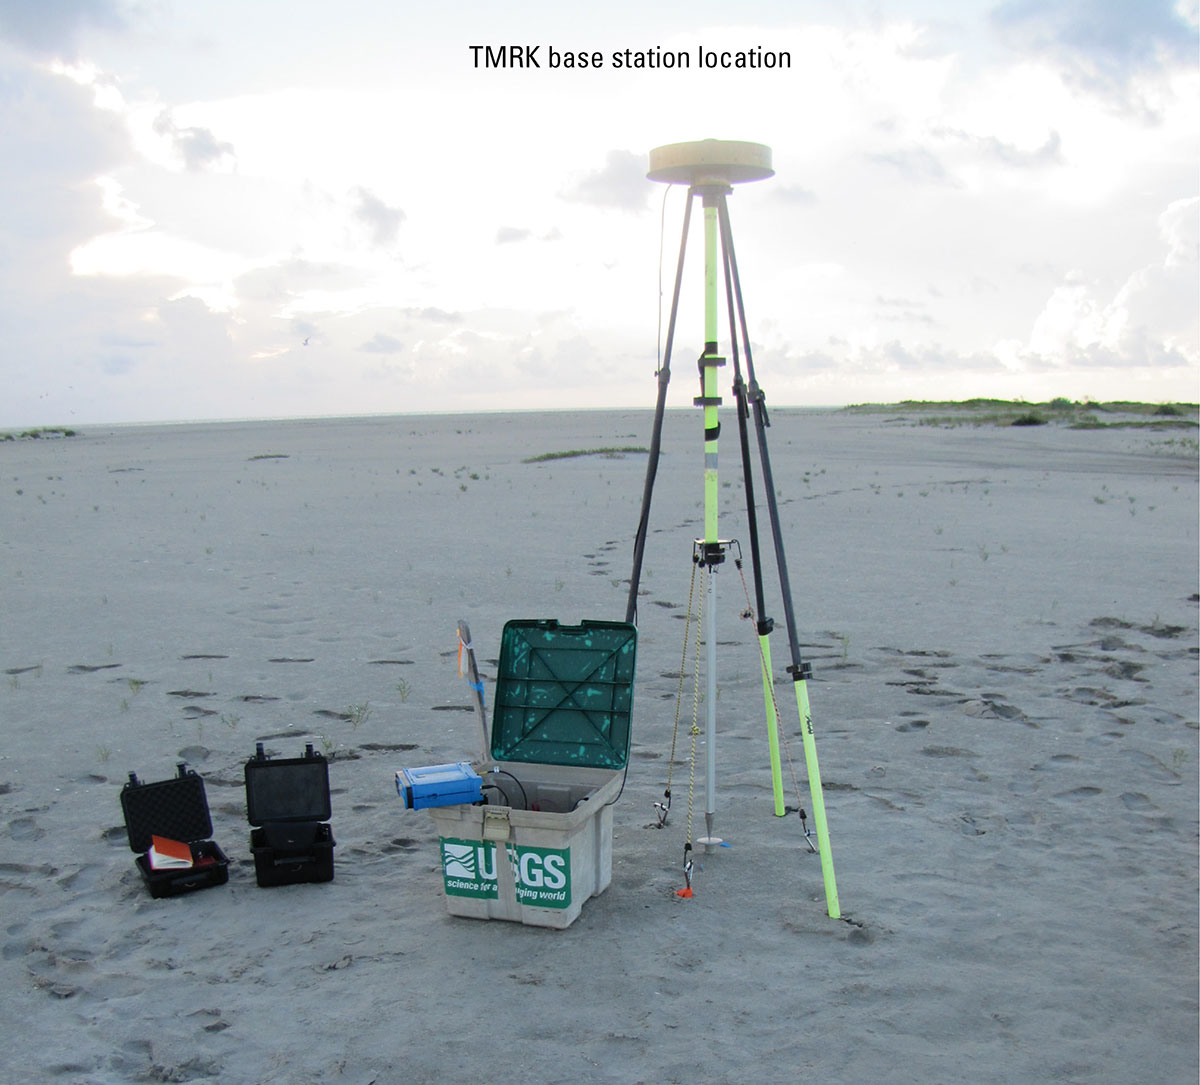 Figure 3. Photograph of the southernmost benchmark (TMRK) occupied during the 2013 bathymetry surveys. [Click to enlarge]  Figure 4. Photograph from the 2013 bathymetry survey showing the benchmark locations of BERM (2012) and BRM2 (2013). In the forefront, sticking out of the water, is the benchmark BERM installed in 2012. This passage of Hurricane Isaac eroded portions of the island rendering BERM unreliable. In the background is the newly installed alternate benchmark location BRM2 showing the GPS base station with the RTK radio antenna atop the 10-meter mast. [Click to enlarge] 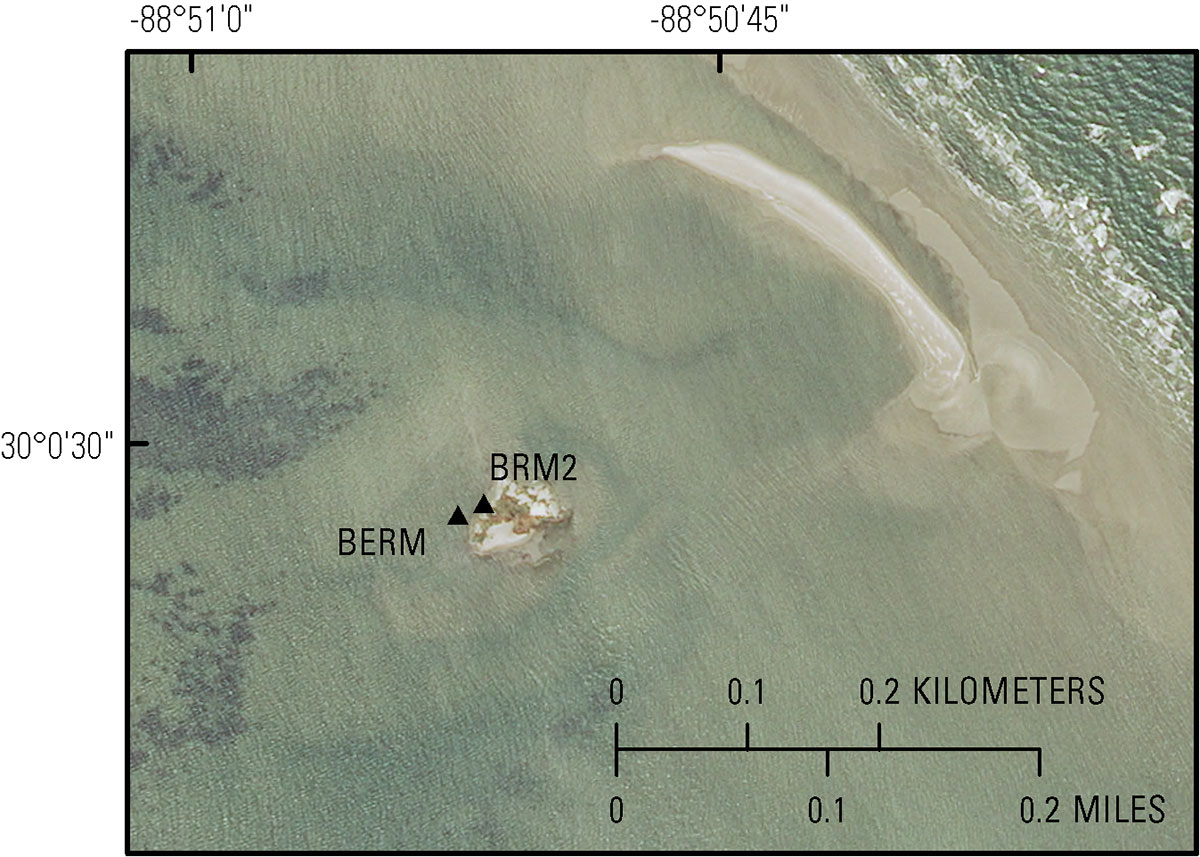 Figure 5. Aerial photograph of benchmark locations BERM (2012, black triangle) and BRM2 (2013, black triangle) at the northern end of the Chandeleur Islands. Aerial photograph from the 2013 National Agriculture Imagery Program (NAIP). The sites are approximately 20 meters apart. [Click to enlarge] Soundings and MotionDepth soundings were acquired aboard the R/V Jabba Jaw (fig. 6) and the R/V Shark (fig. 7) at 100-milliseconds (ms) using an Odom CV100 echosounder system with a 200 kilohertz (kHz) transducer (table 3). Boat motion was recorded on the R/V Jabba Jaw at 50-ms intervals (20 Hz) using a Teledyne TSS Dynamic Motion Sensor (TSS DMS-05) (table 4). The R/V Shark did not record boat motion. To minimize motion errors, the R/V Shark recorded GPS at a high rate (5 Hz) using the Ashtech ProFlex 800 GPS receiver, and utilized a short antenna height (lever-arm) in combination with a narrow (4 degree) transducer beam. All sensor data were saved into a single raw data file (.raw) in HYPACK, with each device string referenced by a device identification code and time stamped to Coordinated Universal Time (UTC). Sound VelocitySound velocity measurements were collected using a Valeport mini Sound Velocity Profiler (SVP) to observe changes in water column speed of sound (SOS) (table 5). A total of 106 sound velocity casts were taken during the surveys. The profiles were later incorporated into the post-processing software to correct the depth for temporal and spatial SOS changes throughout the water column.
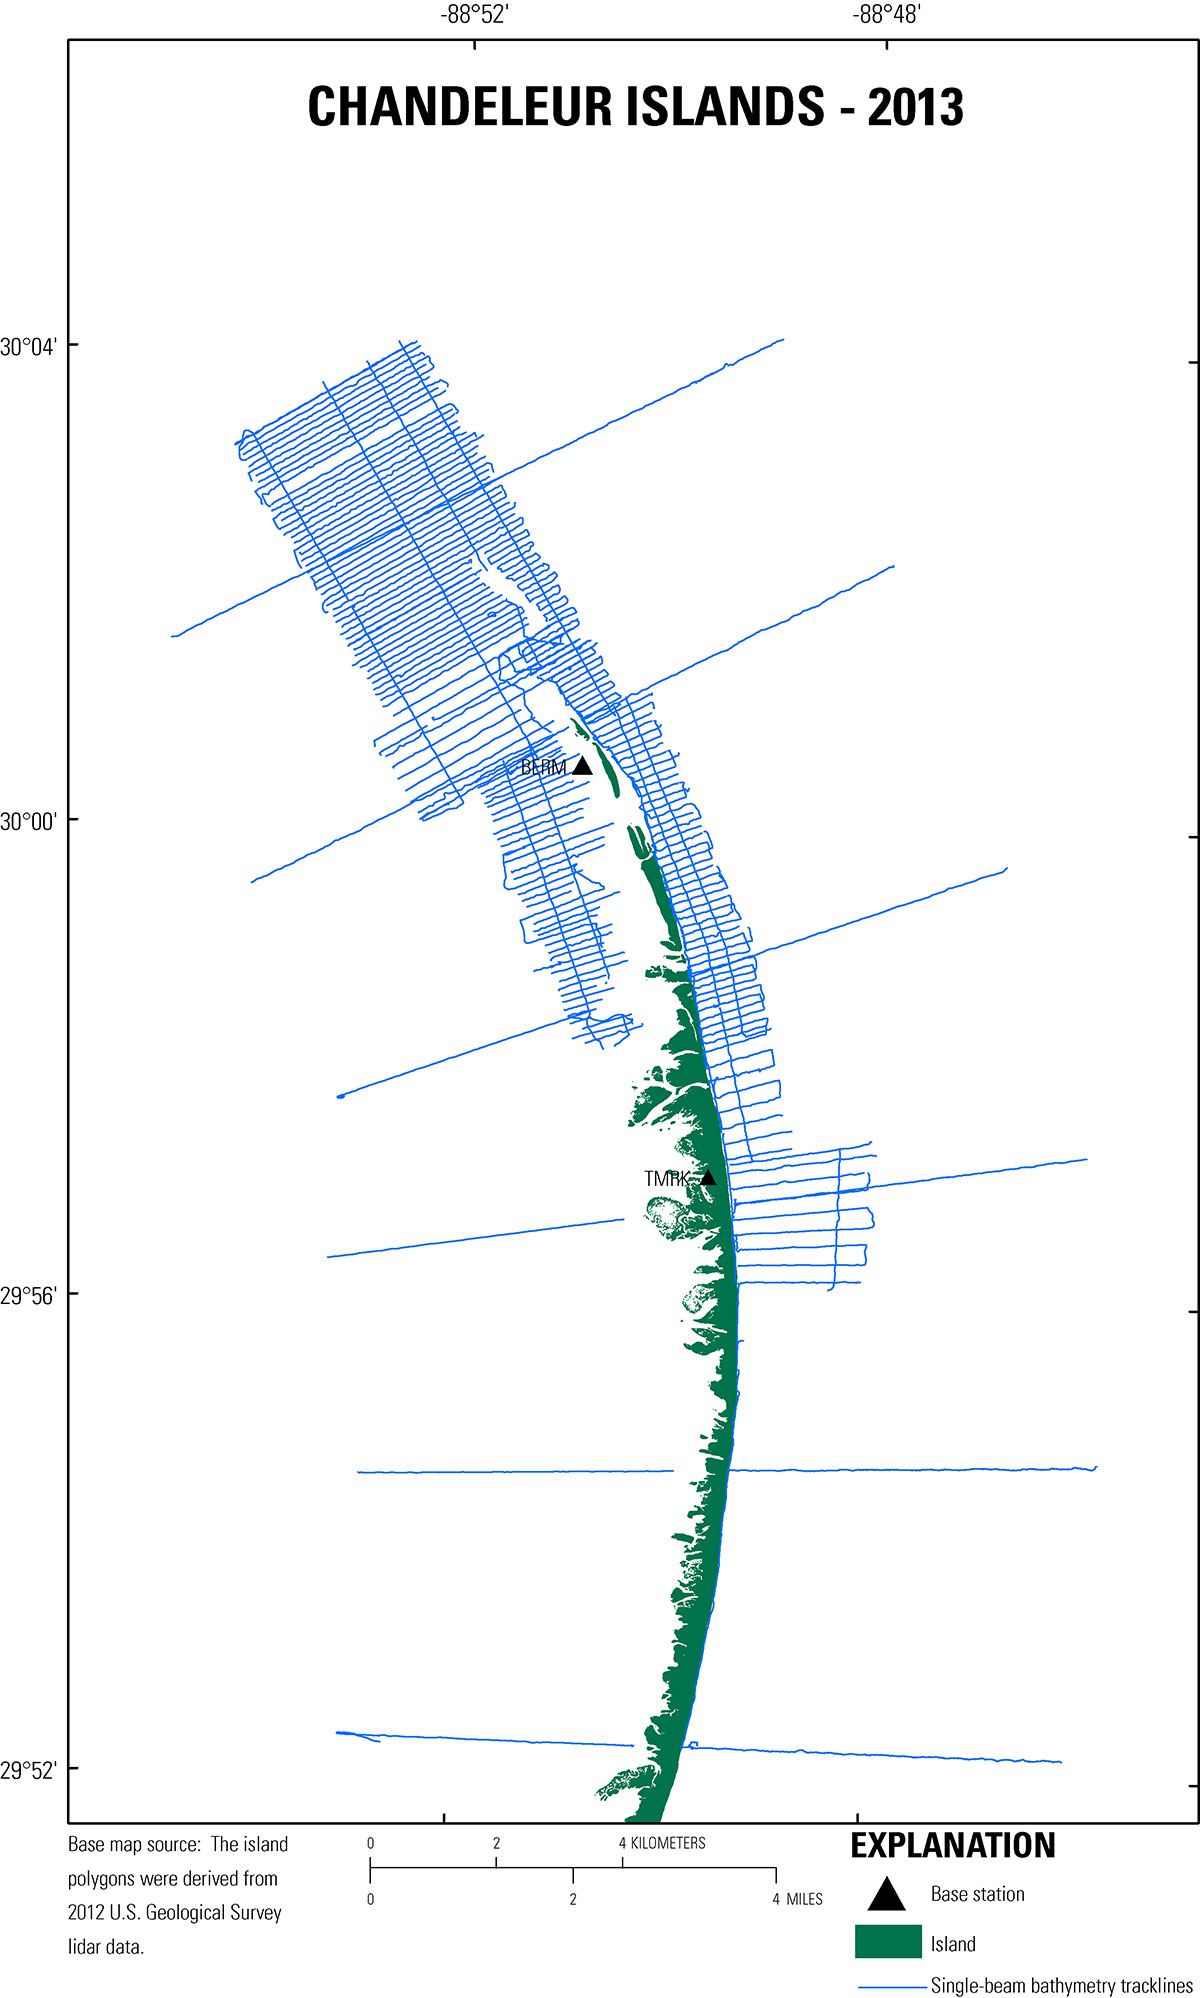 Figure 8. Trackline map coverage showing the 429 line-km (246 lines) of single-beam bathymetry data collection. The island area extent is derived from U.S. Geological Survey light detection and ranging (lidar) collected in 2012 (Guy and others, 2014). [Click to enlarge]
Table 2. Specifications for the Ashtech Z-Xtreme, ProFlex 500, and ProFlex 800 GPS receivers used during the single-beam bathymetry survey, Ashtech_ZXtreme (194-KB PDF), Ashtech_ProFlex500 (228-KB PDF), Ashtech_ProFlex800 (194-KB PDF).
Table 3. Specifications for the ODOM CV100 Echosounder used during the single-beam bathymetry survey, Odom_Echotrac_CV100 (116-KB PDF).
Table 4. Specifications for the Teledyne TSS-DMS-05 motion sensor used during the single-beam bathymetry survey, TSS-DMS-05 (202-KB PDF).
Table 5. Specifications for the Valeport mini sound velocity profiler used during the single-beam bathymetry survey to collect speed of sound profiles through the water column, Valeport_miniSVP (135-KB PDF).
Interferometric Swath BathymetryNavigation and MotionThe navigation and motion data were recorded using a Coda-Octopus F190R Precision Attitude and Positioning System (table 6) that consists of a top-side GPS and a waterproof inertial measurement unit (IMU). The position data were corrected in real-time using Marinestar HP differential navigation service provided through Fugro. The IMU applied real-time measurements for heave, roll, and pitch and was located directly between the transducer heads to minimize lever arm geometry errors between the observed depths and associated vessel motion. The F190R Software program accounted for equipment offsets and a calibration was performed every survey day. The corrected positions from the F190R were integrated with the observed bathymetric values to calculate a final position (x,y,z) with the vertical (z) being ellipsoid height representing the elevation of the seafloor with respect to the geodetic reference frame International Terrestrial Reference Frame 2008 (ITRF08) across the swath range. Planned survey tracklines were loaded into HYPACK version 2011 as a navigation guide for the boat operator. SoundingsThe interferometric swath bathymetry data were collected aboard the R/V Sallenger using a 468 kHz Systems Engineering and Assessment Ltd. (SEA), SWATHplus-H (high frequency) interferometric sonar system (table 7). SWATHplus serves as both an acquisition software and initial processing software. Preliminary roll calibration trackline data were collected and processed using SEA SWATHplus version 3.07.17. The roll calibration lines were processed using Grid Processor software version 3.07.17. Prior to deployment, all physical equipment offsets were surveyed in dry dock with a laser total station. Both the physical instrument offsets and the roll calibration offsets were entered into the SWATHplus session file (.sxs) during acquisition. During the survey, all swath tracklines were recorded in raw data format (.sxr). Sound VelocityAccurate SOS values throughout the water column are essential to accurate seafloor mapping with a swath system, particularly at swath beam range extents, and most notably at depths greater than 3 meters (m), where SOS has commonly demonstrated variability due to thermoclines and changes in salinity. If SOS is inaccurate, water column refraction will significantly decrease data precision and accuracy throughout the beam range of the swath signal, particularly at the far range. A Valeport Mini Sound Velocity Sensor (SVS) (table 8) was attached to the transducer mount and collected continuous SOS measurements at the depth of the transducers. These SOS values were streaming continuously into the SWATHplus acquisition software giving real-time SOS at the transducer head while underway (table 8). In addition, a separate Valeport miniSVP was used to collect SOS profiles (water surface to seafloor) at strategic intervals throughout the survey (table 5). As SOS profiles were collected the session files were updated accordingly to reflect the most current sound velocity measurements which assisted in monitoring swath data quality. 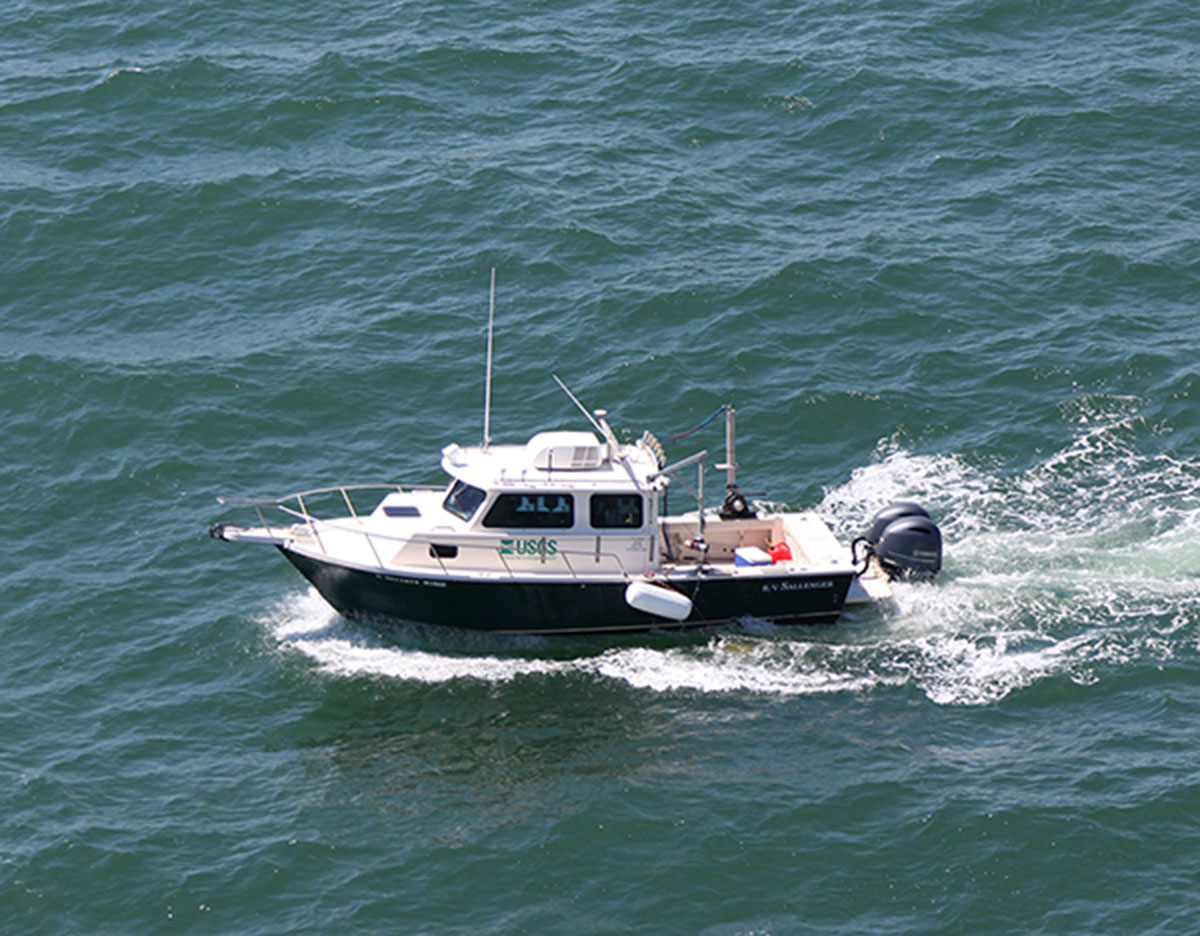 Figure 9. Photograph of the R/V Sallenger underway towing the chirp subbottom profiler on the port side and the rigid pole mounted swath on the starboard side. [Click to enlarge] 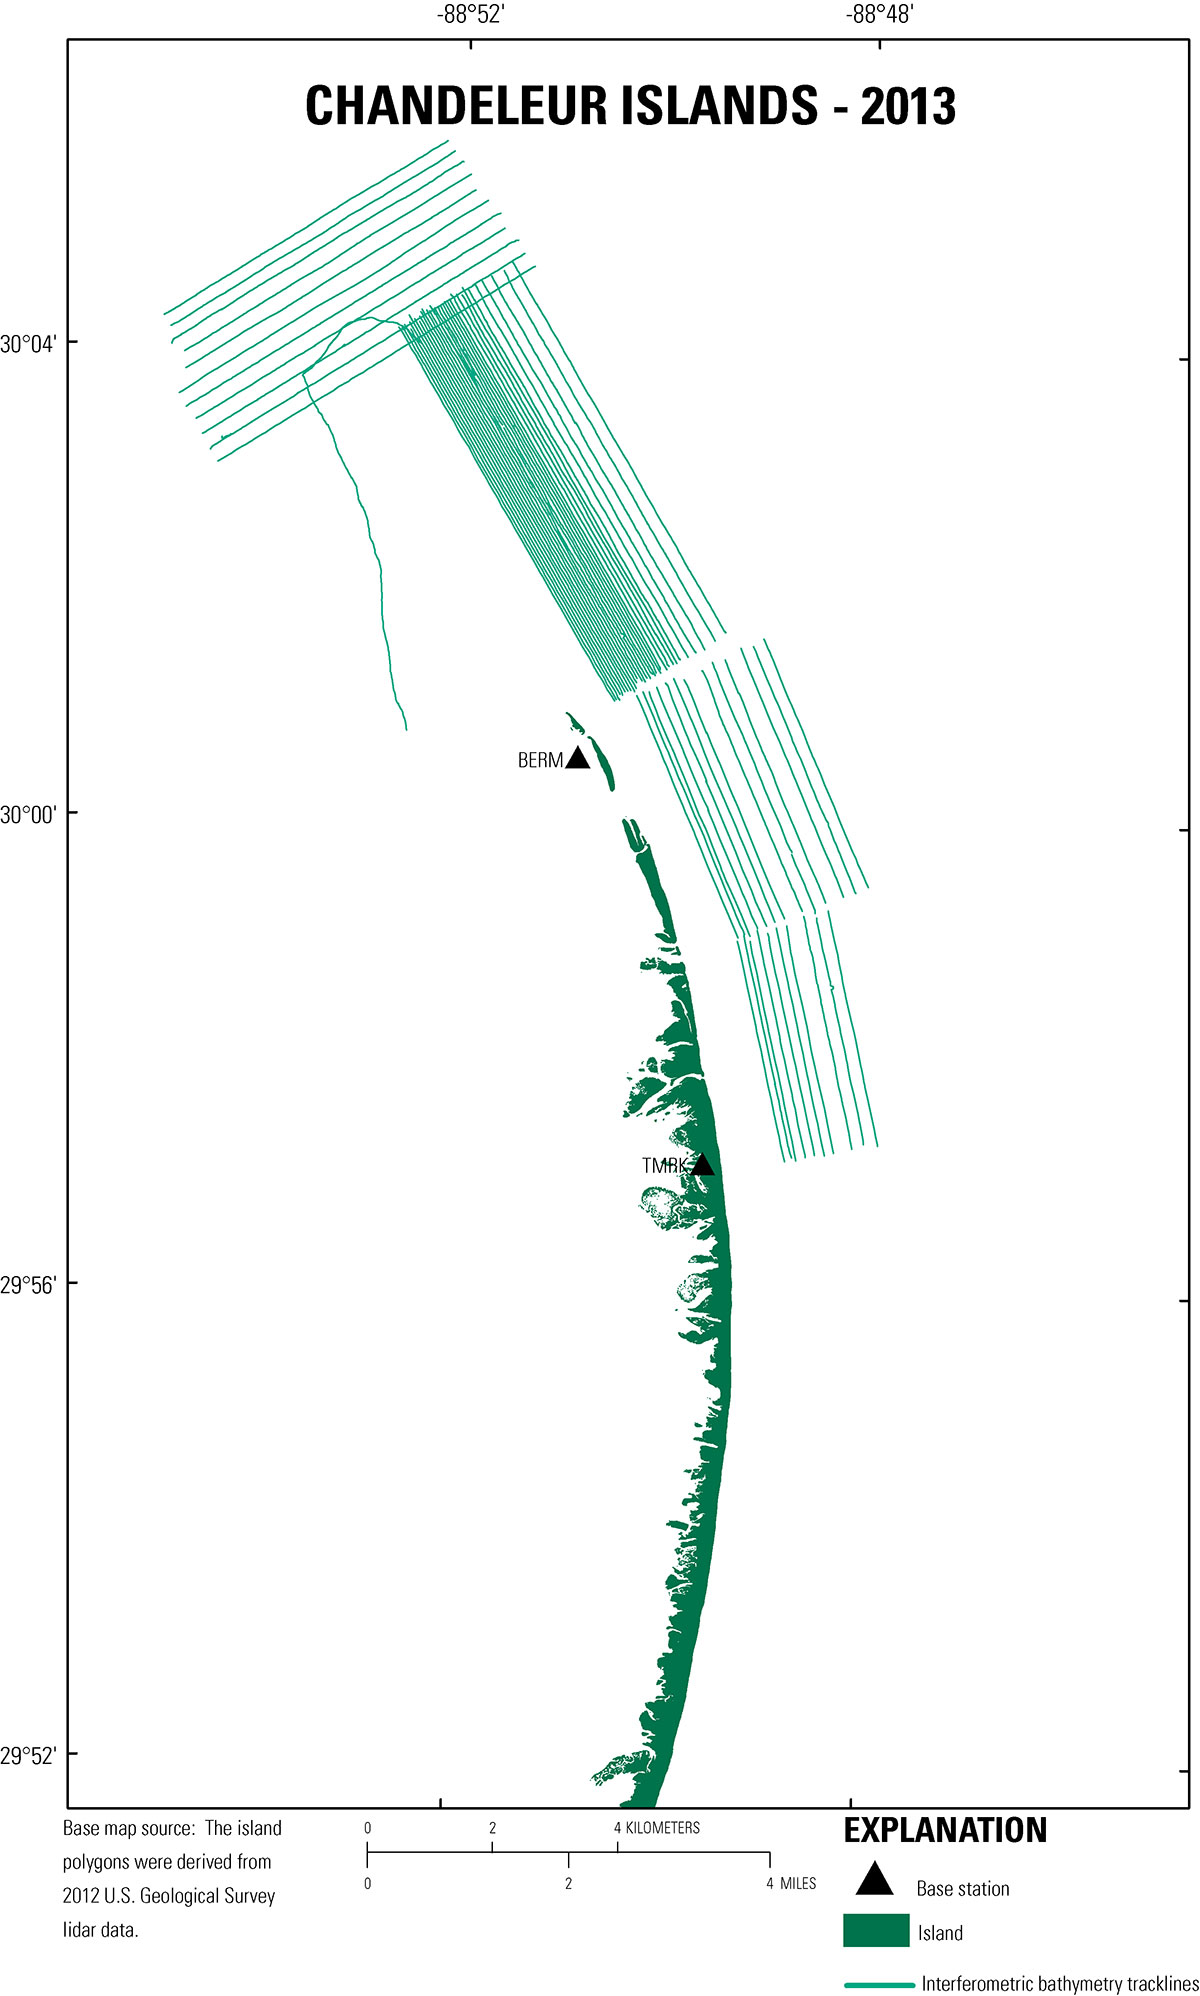 Figure 10. Trackline map coverage showing the 375 line-km (98 lines) of interferometric swath bathymetry data collection. The island area extent is derived from U.S. Geological Survey light detection and ranging (lidar) collected in 2012 (Guy and others, 2014). [Click to enlarge]
Table 6. Specifications for the Coda Octopus F190R inertial measurement unit (IMU) used during the interferometric swath bathymetry survey, Coda Octopus Group, Inc., F180 Series (1.84-MB PDF). Measurements are expressed in centimeters (cm), meters (m), meters per second (m/s), and seconds (s).
Table 7. Specifications for the Swathplus-H sonar system (SEA Ltd.) transducers used to collect interferometric swath bathymetry data during the survey, Swathplus (175-KB PDF). Measurements are expressed in centimeters (cm), kilohertz (kHz), meters (m), and microseconds (μSEC).
Table 8. Specifications for the Valeport MiniSVS used to collect continuous sound velocity, co-located with the bathymetry transducers and inertial motion unit, Valeport_miniSVS (148-KB PDF). Measurements are expressed in hertz (Hz), millimeters (mm), and meters per second (m/s).
Note: To view PDF documents the latest version of Adobe Reader or similar software is required. Disclaimer: Any use of trade names is for descriptive purposes only and does not imply endorsement by the U.S. Government. |
|||||||||||||||||||||||||||||||||||||||||||||||||||||||||||||||||||||||||||||||||||||||||||||||||||||||||||||||||||||||||||||||||||||||||||||||||

![]() U.S. Department of the Interior |
U.S. Geological Survey
U.S. Department of the Interior |
U.S. Geological Survey
URL: http://pubsdata.usgs.gov/pubs/ds/1032/ds1032_overview.html
Page Contact Information: GS Pubs Web Contact
Page Last Modified: Wednesday, 04-Jan-2017 15:39:46 EST