Data Series 1032
| Data ProcessingSingle-Beam BathymetryNavigationThe coordinate values for each of the GPS base stations (TMRK and BRM2) are the time-weighted average of values obtained from the National Geodetic Survey's (NGS) On-Line Positioning User Service (OPUS). Depending on the survey design, the coordinates were utilized either during acquisition to provide RTK navigation, or imported into the post-processing software GrafNav (Waypoint Product Group). For post processing, the kinematic GPS data from the survey vessels were processed to the concurrent GPS data from the base stations. Steps were taken to ensure that the trajectories between the base and rover were clean and resulted in fixed positions. GPS data quality could be monitored and manipulated by analyzing the graphs, trajectory maps, and processing logs that GrafNav produces for each GPS session. If poor GPS data was identified, some common tools used to improve the solution included, but were not limited to, omitting a satellite flagged as poor in health, excluding time-segments with cycle slips, or adjusting the satellite elevation mask angle. The final, differentially-corrected, precise DGPS positions were computed at 1-second (s) intervals for each roving GPS session, and then exported in American Standard Code for Information Interchange (ASCII) text format, which replaced the uncorrected real-time rover positions recorded during acquisition. The GPS data were processed and exported in the World Geodetic System of 1984 (WGS84) (G1150) geodetic datum. For USGS cruises 13BIM03 and 13BIM04, RTK navigation was implemented. The OPUS derived base station coordinates were programed into their respective base station GPS receivers and position corrections were broadcasted via radio link to the roving GPS receivers located on each survey vessel. However, 13BIM04 was ultimately post-processed using GrafNav version 8.50 after identification of some unreliable navigation segments. RTK was not implemented during cruise 13BIM08, so navigation data was post-processed using GrafNav version 8.6. Soundings and MotionThe raw HYPACK version 10.0.5.31 data files were imported into CARIS HIPS and SIPS (Hydrographic Information Processing System and Sonar Information Processing System) version 8.1.5 (13BIM03 and 13BIM04) and version 8.1.7 (13BIM08). The corrected DGPS positions exported from GrafNav were imported into CARIS using the generic data parser tool within CARIS, and any SVP casts were entered with the SVP editor in CARIS. The data parser was not needed for files collected using RTK unless otherwise noted. The bathymetric data components (position, motion, depth, and SOS) were then merged and geometrically corrected in CARIS to produce processed x,y,z data. Once merged, the dataset was visually evaluated to identify erroneous points using the Single Beam Editor. Erroneous (horizontally or vertically offset) point data may result from cavitation in the water column obscuring the fathometer signal, tight turns in the surf zone possibly affecting the tracking of the incoming GPS signal, and (or) false readings due to general equipment issues. Data points in areas of extremely shallow water (0.30 m to 0.50 m) such as shoals and seagrass beds are also reviewed against the surrounding data for coherency. Next, a Bathymetry with Associated Statistical Error (BASE) surface was created. Using the subset editor, the BASE surface provided a color-coded guide to pinpoint crossings that were visually offset from one another. After the dataset was reviewed and any offset data removed or reprocessed, the geometrically corrected point data were exported as an x,y,z ASCII text file referenced to WGS84 (G1150), equivalent to International Terrestrial Reference Frame 2000 (ITRF00), with ellipsoid height in meters. The single-beam bathymetry dataset consists of 1,867,975 x,y,z data points with an ellipsoidal elevation range of -27.802 m to -41.246 m, a mean of -31.715 m, and a standard deviation of 2.41 m. Using the National Oceanic and Atmospheric Association (NOAA) transformation software, VDatum version 3.2, the data were converted horizontally and vertically into the North American Datum of 1983 (NAD83) (CORS96) and the North American Vertical Datum 1988 (NAVD88) (orthometric height) using the NGS geoid model of 2009 (GEOID09). The transformed point data were imported into Esri ArcGIS version 10.0.5 as a shapefile and ultimately merged with the swath bathymetric point data for gridding purposes. Swath BathymetryNavigation and MotionPosition data, recorded by the Coda-Octopus F190R IMU system, were corrected in real-time with the Marinestar HP differential navigation service. The IMU also applied real-time motion corrections for heave, roll, and pitch to the vertical component of each position fix. The corrected positions were integrated with the observed bathymetric values to calculate a final position and ellipsoid height representing the elevation of the seafloor with respect to the geodetic reference frame ITRF2008 (ITRF08) across the swath range. SoundingsThe Systems Engineering and Assessment Ltd., program SWATHplus serves as acquisition software and initial processing software. The session files (.sxs) created during acquisition that contained the roll calibration values, the pre-surveyed instrument offsets, pertinent SVP casts, and preliminary bathymetry filters were imported into SWATHplus and verified for consistency. The system configuration file was verified and updated to include or reflect any parameter changes specific to the lines being processed. This can include additional manipulation of the SVP casts; offset adjustments, additional bathymetry and acoustical filters, or updated roll calibration values. The raw data files (.sxr) were then processed using the updated session configurations and the corrected data was written to a processed data file (.sxp). The initial datum for the swath and backscatter data was ITRF08, which is the real-time acquisition datum of Marinestar HP position and navigation data. All processed data files (.sxp) were imported into CARIS HIPS and SIPS version 8.1.7. Outliers for the navigation data and processed soundings were removed using program filters. A manual editor then identified and removed any remaining outliers based on visual interpretation of the dataset. A CARIS BASE surface with associated Combined Uncertainty and Bathymetry Estimator (CUBE) sample surface was created from the edited soundings. A CUBE hypothesis is the estimated value of a grid node representing all the soundings within a chosen resolution or grid-cell size (for example, 5 m) weighted by uncertainty and proximity, giving the final value as a "sample" of the data within the specific grid cell. This algorithm allows for multiple grid-node hypotheses to be verified or overridden by the user while maximizing processing efficiency. A 5-m resolution CUBE surface was created to perform initial hypothesis editing using the CARIS Subset Editor tool, followed by higher resolution surface detail editing within subset editor. The sample x,y,z data were exported as ASCII text at a 5-m by 5-m sample resolution along tracklines in the ellipsoid datum of ITRF08. The processed data product resulted in seafloor coverage of 51 percent. The data were then transformed into NAD83 and NAVD88 (GEOID09) using VDatum version 3.3. Digital Elevation Model (DEM)The point data from the interferometric swath system (samples from the 5-m BASE surface nodes) and single-beam soundings were imported into Esri ArcGIS ArcMap version 10.3.1, and the point data were merged into a single x,y,z shapefile dataset containing 3,712,480 points. Using ArcGIS, the swath and single-beam elevations were examined for spatial distribution and vertical agreement. A triangulated irregular network (TIN) was generated from the shapefile to provide unassuming linear predictions over data gaps to aid in gridding the data into a raster layer or DEM. Converting the data points to a TIN surface disallows predictions outside the actual data range. The TIN surface and elevation-point shapefile were used conjointly to visually scan for discrepancies, which were consequently edited or removed. Once all data were reviewed, a 50-m by 50-m cell resolution DEM was generated using the natural neighbor algorithm in ArcGIS software (fig. 11). A polygon was created to the extent of the survey tracklines and then converted into a raster mask using the ArcGIS "polygon to raster" conversion tool. The DEM was then clipped to the raster mask using the ArcGIS Spatial Analyst "extract by raster mask" tool. This excluded a small portion (approximately 35 line-km) of the six long shoreline perpendicular lines (figs. 2 and 8) from the DEM to avoid unnecessary interpolation from a limited number of data points. It is common in large-area, shallow water surveys to find wide data gaps between tracklines relative to the swath width surveyed. To minimize this concern in the final DEM, the ArcGIS Spatial Analyst "neighborhood" low-pass raster-data filter was applied. The North American Vertical Datum of 1988 (NAVD88) orthometric elevation range for all of the processed bathymetric data (SBB and IFB) was -0.32 m to -15.31 m (fig. 11), derived using the National Geodetic Survey's (NGS) geoid model of 2009 (GEOID09). 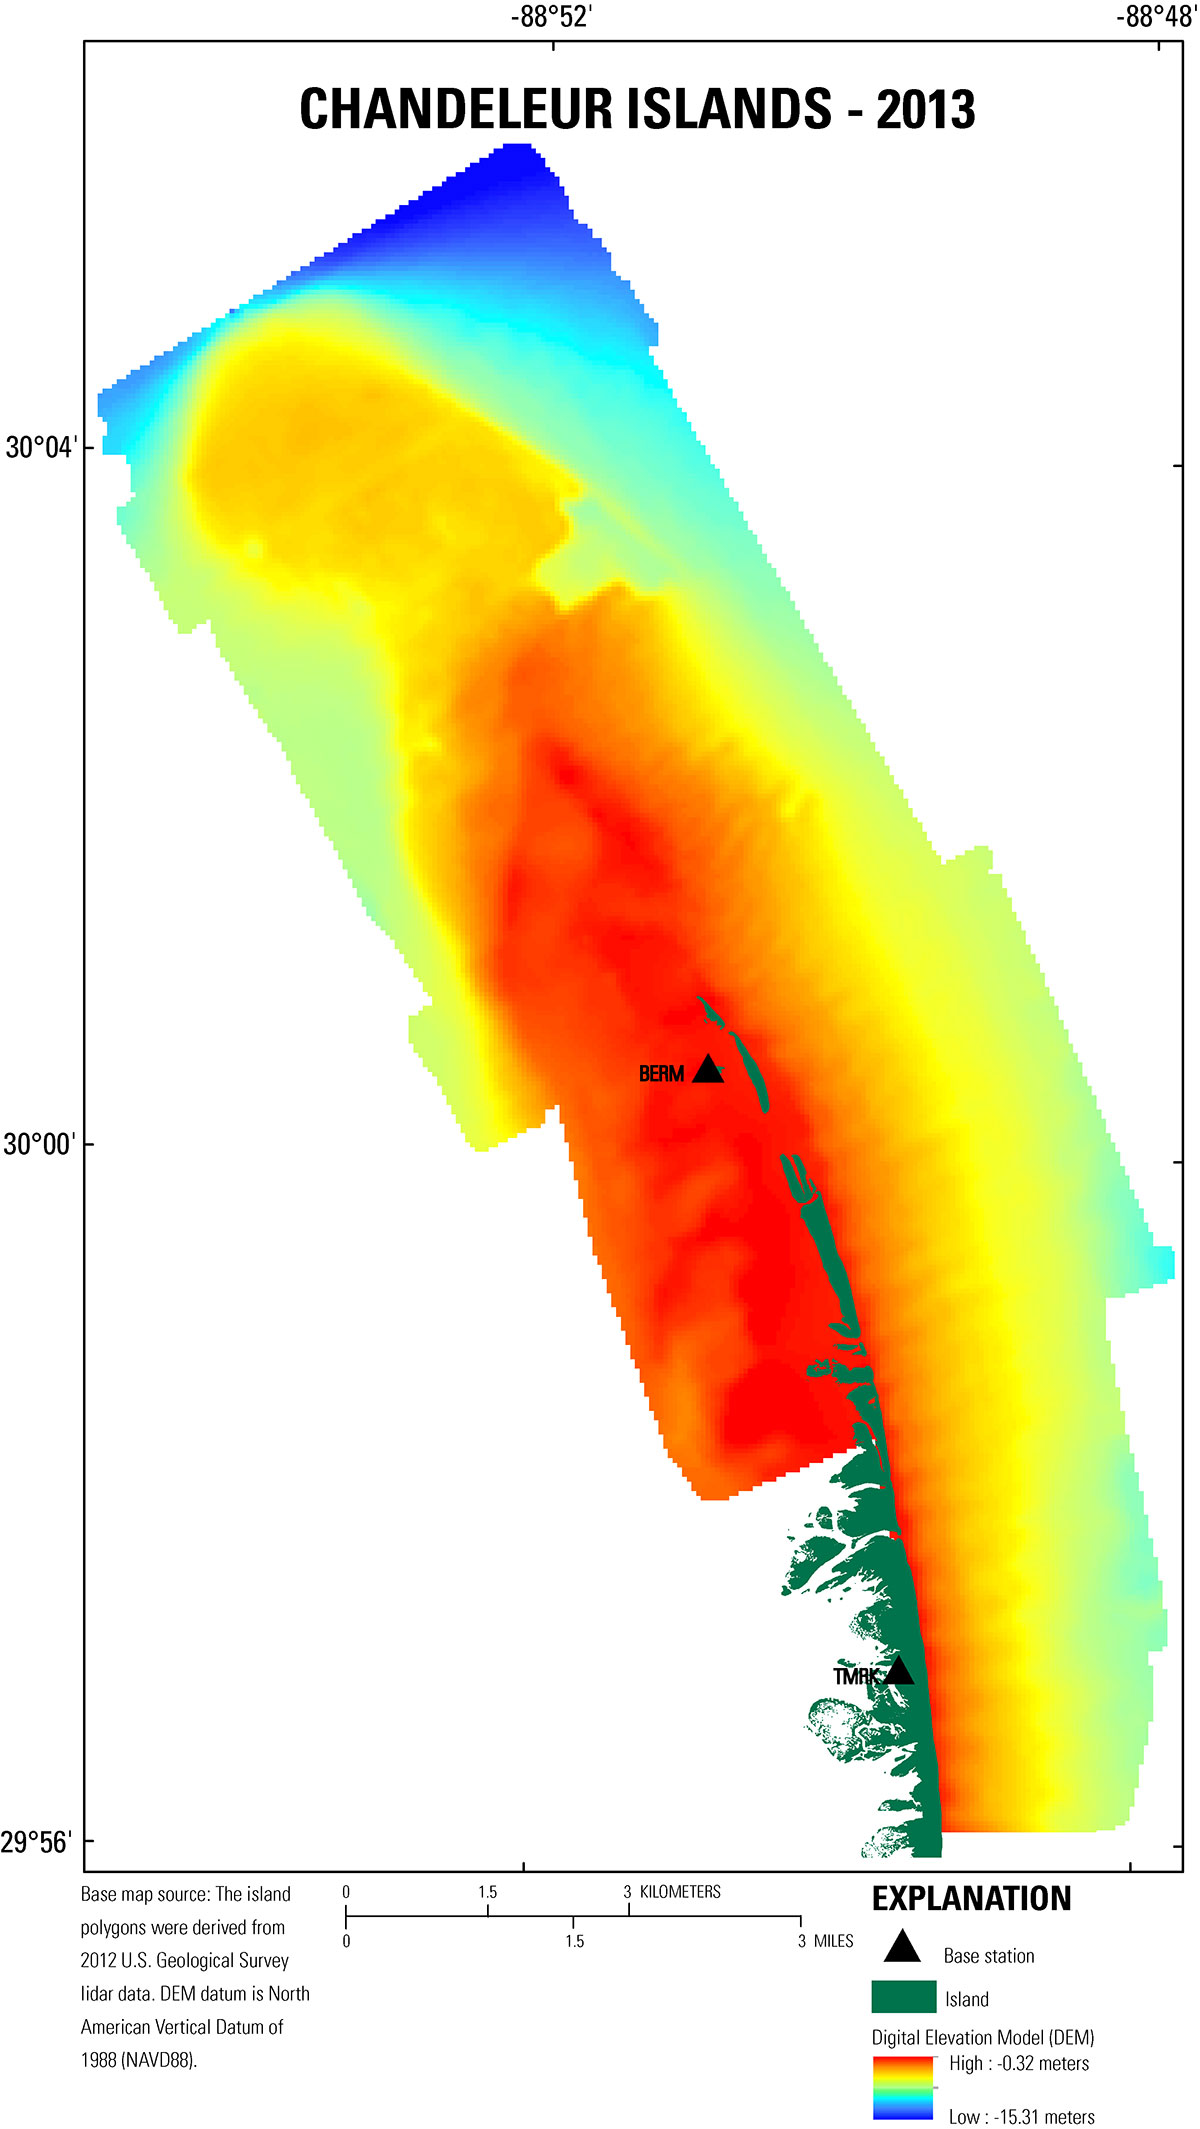 Figure 11. A 50-meter digital elevation model of 2013 bathymetry surrounding the Chandeleur Islands, Louisiana. The island area extent is derived from U.S. Geological Survey light detection and ranging (lidar) collected in 2012 (Guy and others, 2014). [Click to enlarge] Note: Any use of trade names is for descriptive purposes only and does not imply endorsement by the U.S. Government. |

![]() U.S. Department of the Interior |
U.S. Geological Survey
U.S. Department of the Interior |
U.S. Geological Survey
URL: http://pubsdata.usgs.gov/pubs/ds/1032/ds1032_processing.html
Page Contact Information: GS Pubs Web Contact
Page Last Modified: Wednesday, 04-Jan-2017 15:39:46 EST
