|
| | Survey Products
| Tracklines |
Bathymetry |
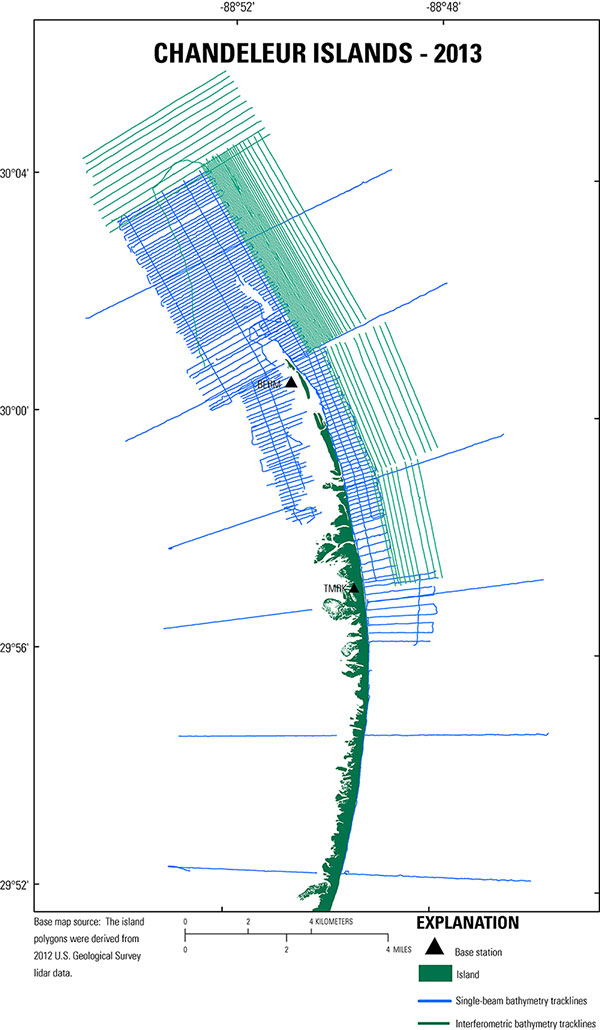
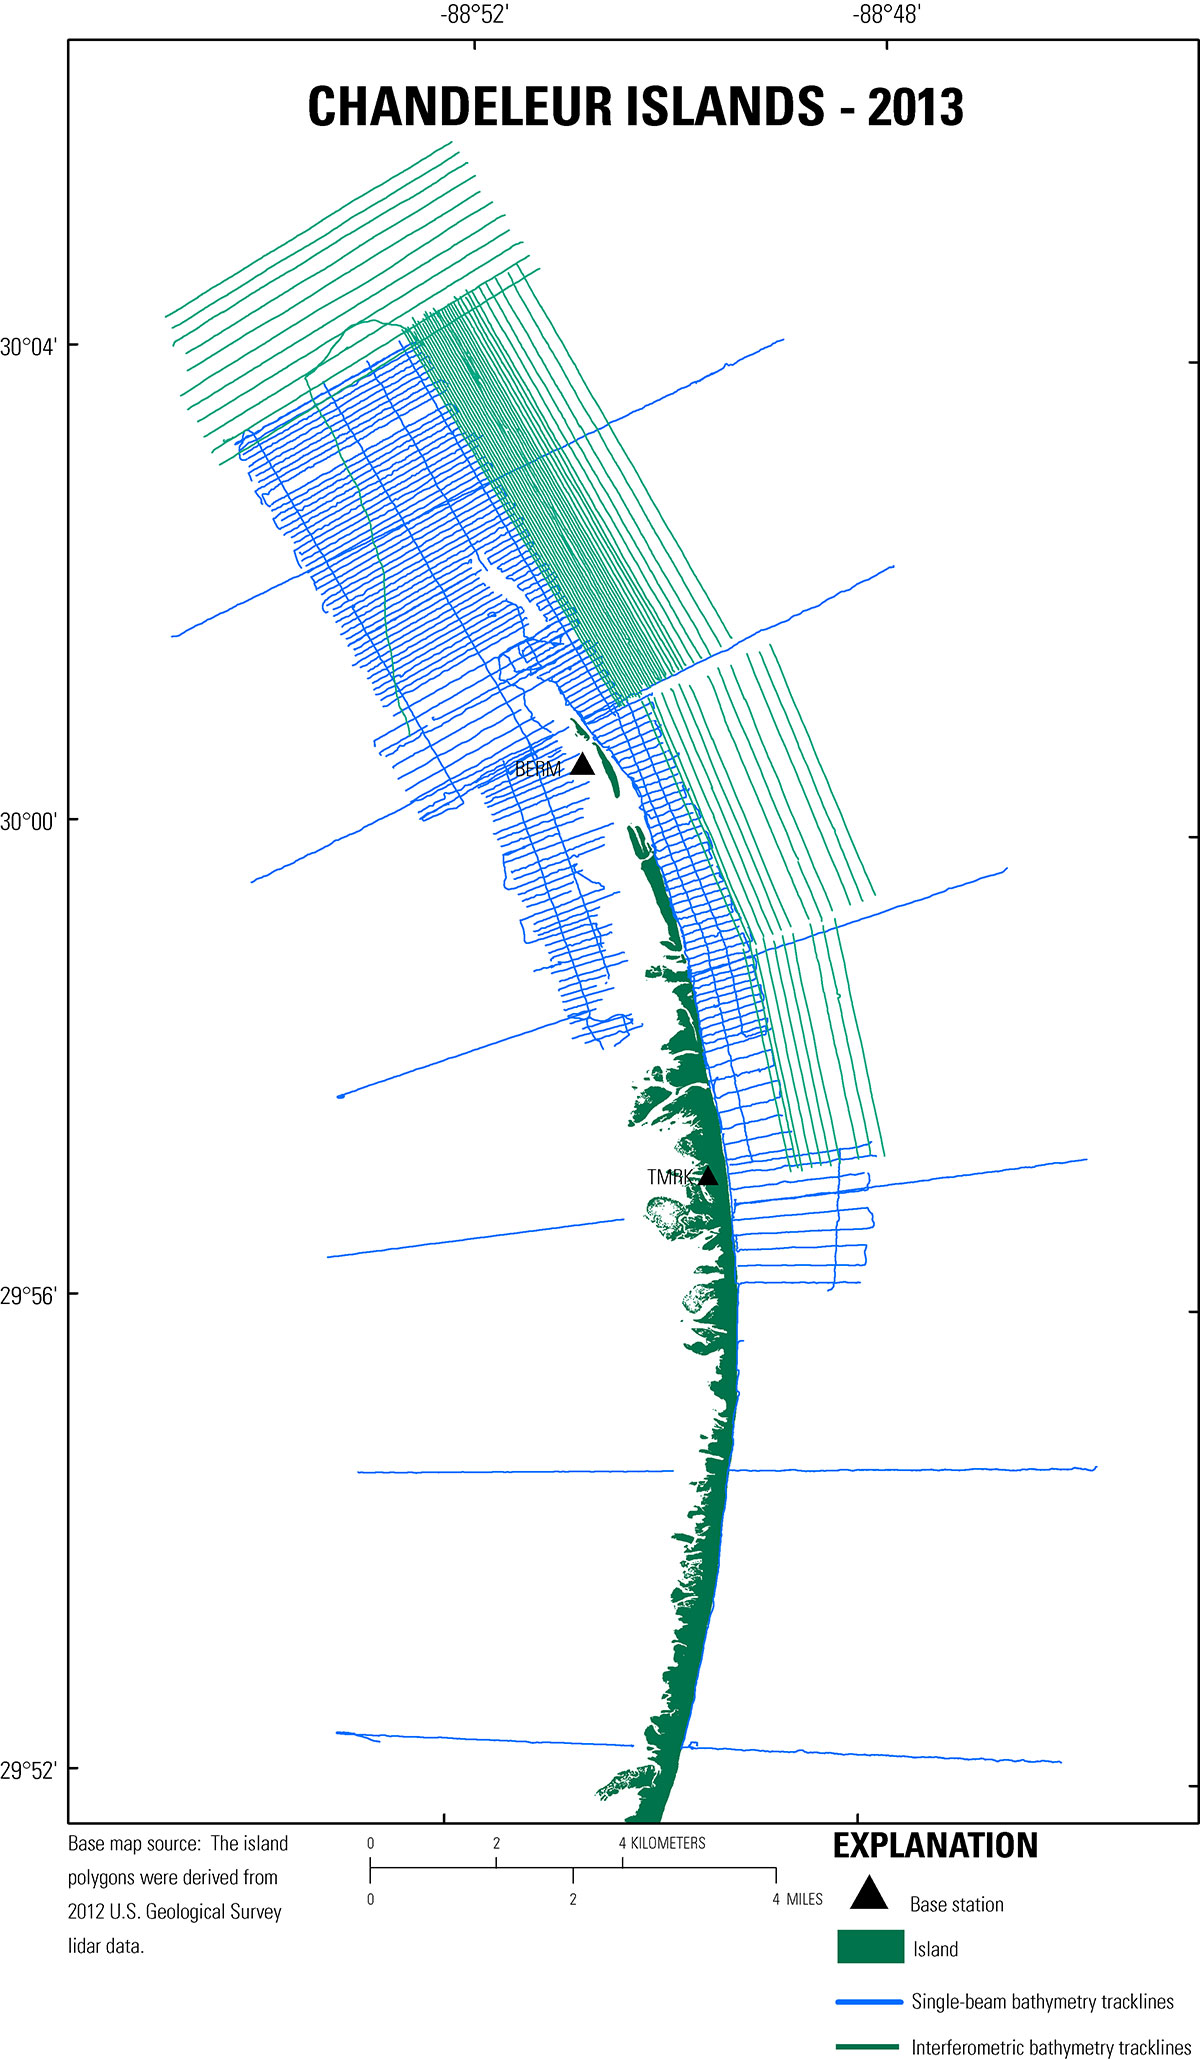
Figure 2. Trackline map overview for the 2013 geophysical surveys in the northern Chandeleur Islands, Louisiana. Blue tracklines represent single-beam bathymetry. Green tracklines represent interferometric swath bathymetry. The island area extent is derived from U.S. Geological Survey light detection and ranging (lidar) collected in 2012 (Guy and others, 2014). [Click to enlarge] |
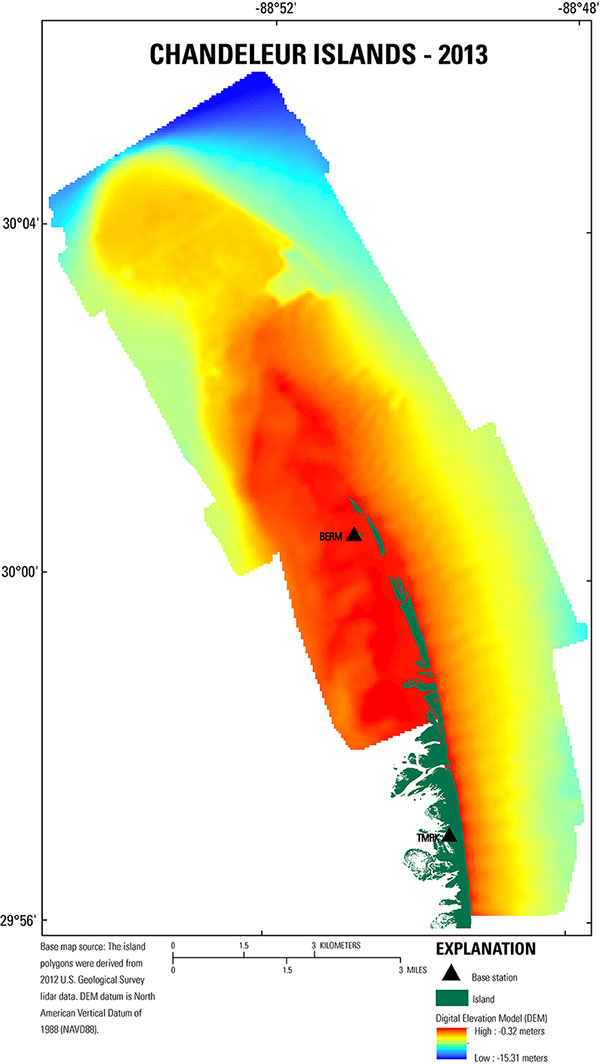
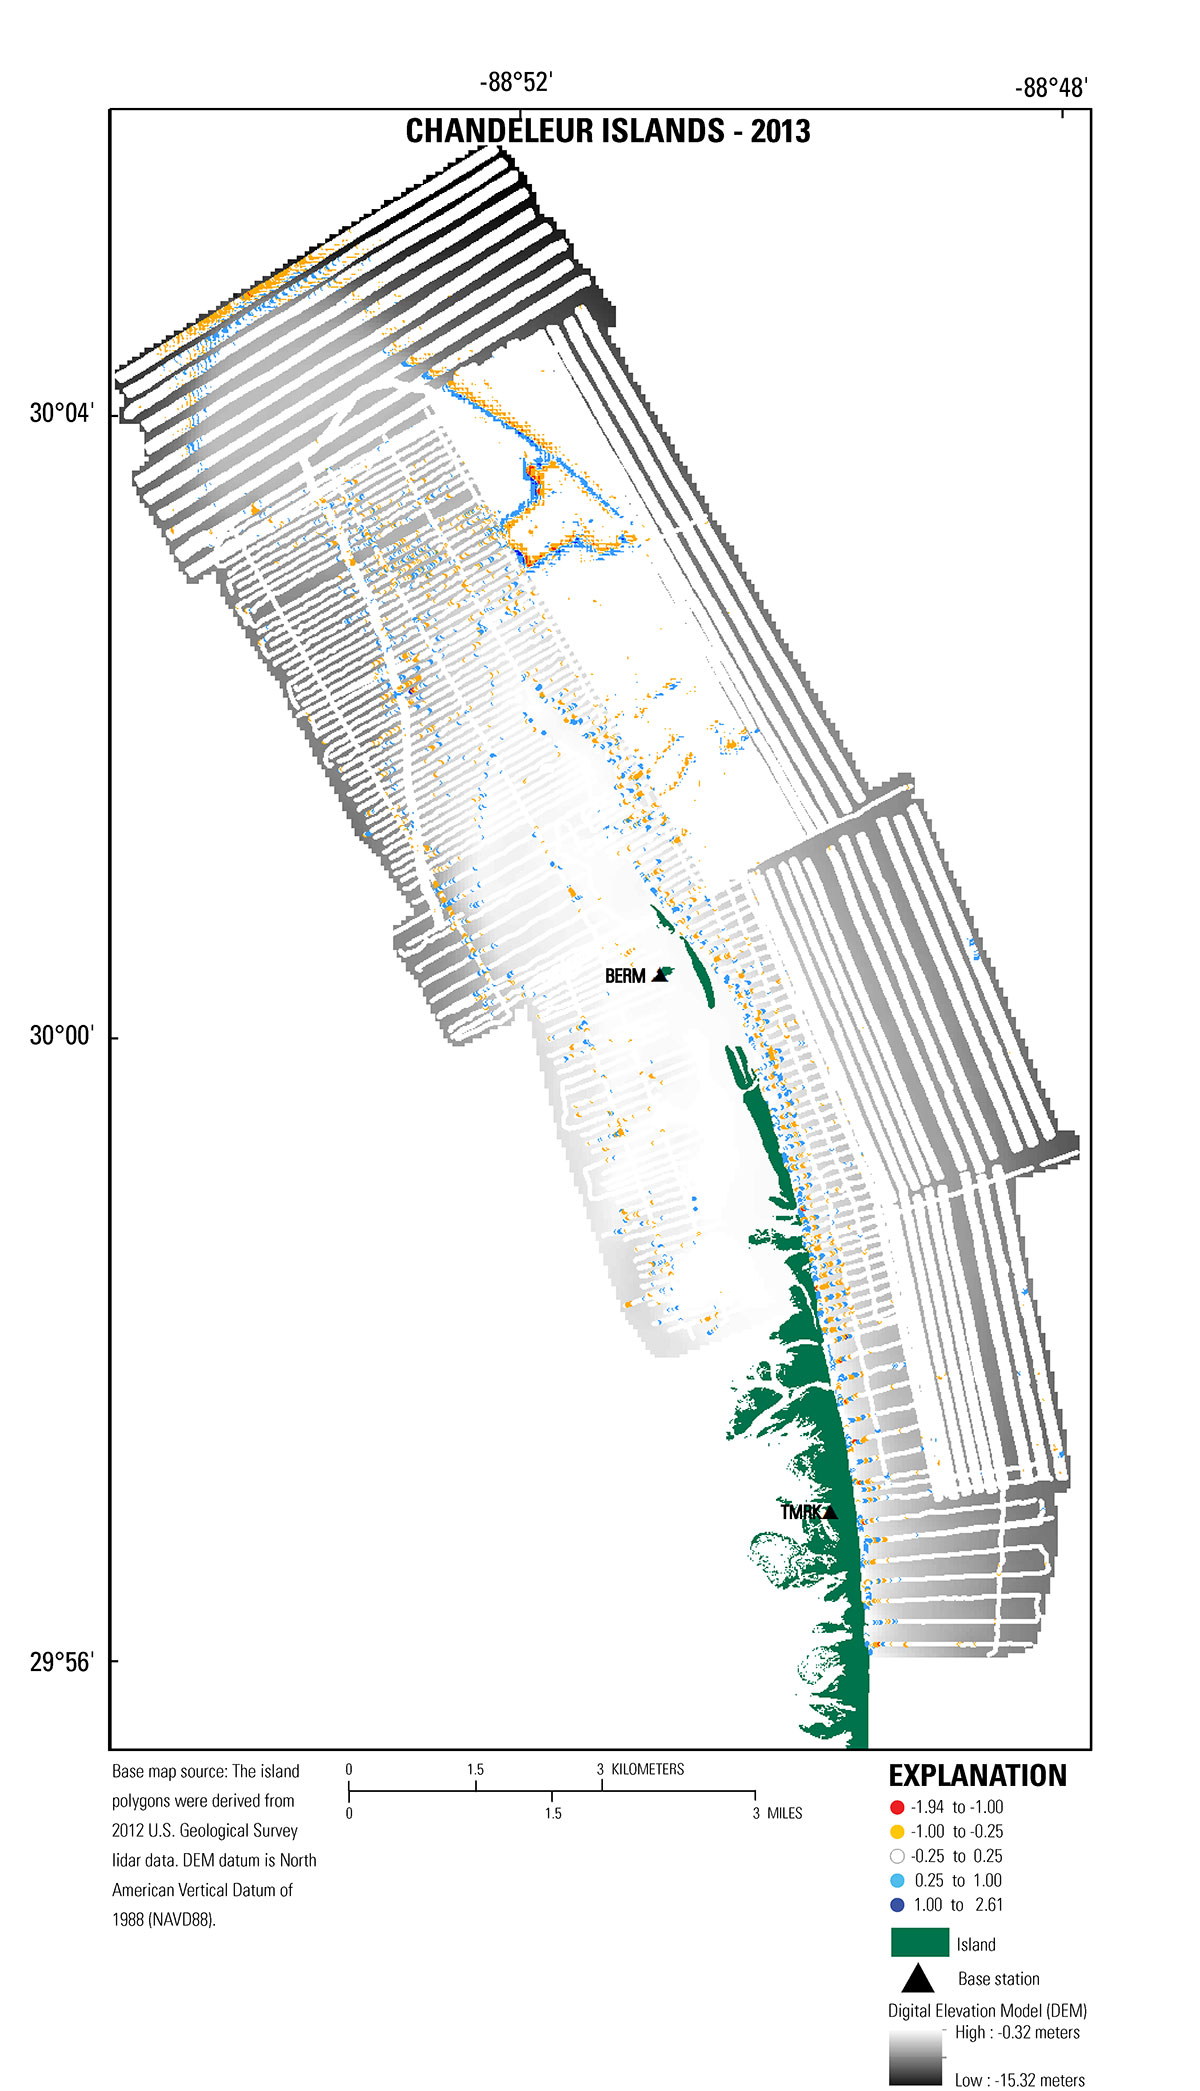
Figure 11. A 50-meter digital elevation model of 2013 bathymetry surrounding the Chandeleur Islands, Louisiana. The island area extent is derived from U.S. Geological Survey light detection and ranging (lidar) collected in 2012 (Guy and others, 2014). [Click to enlarge]
|
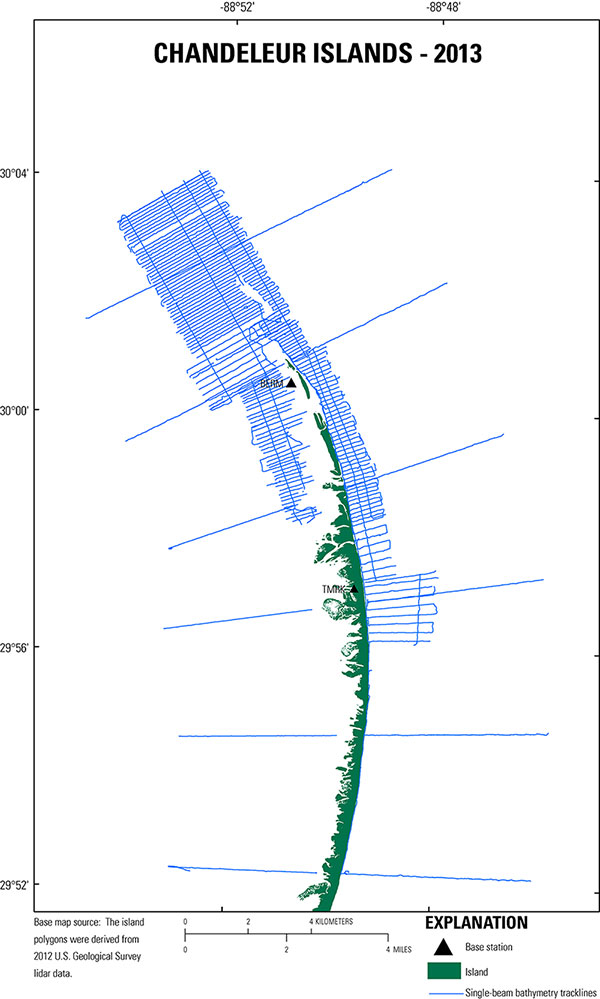
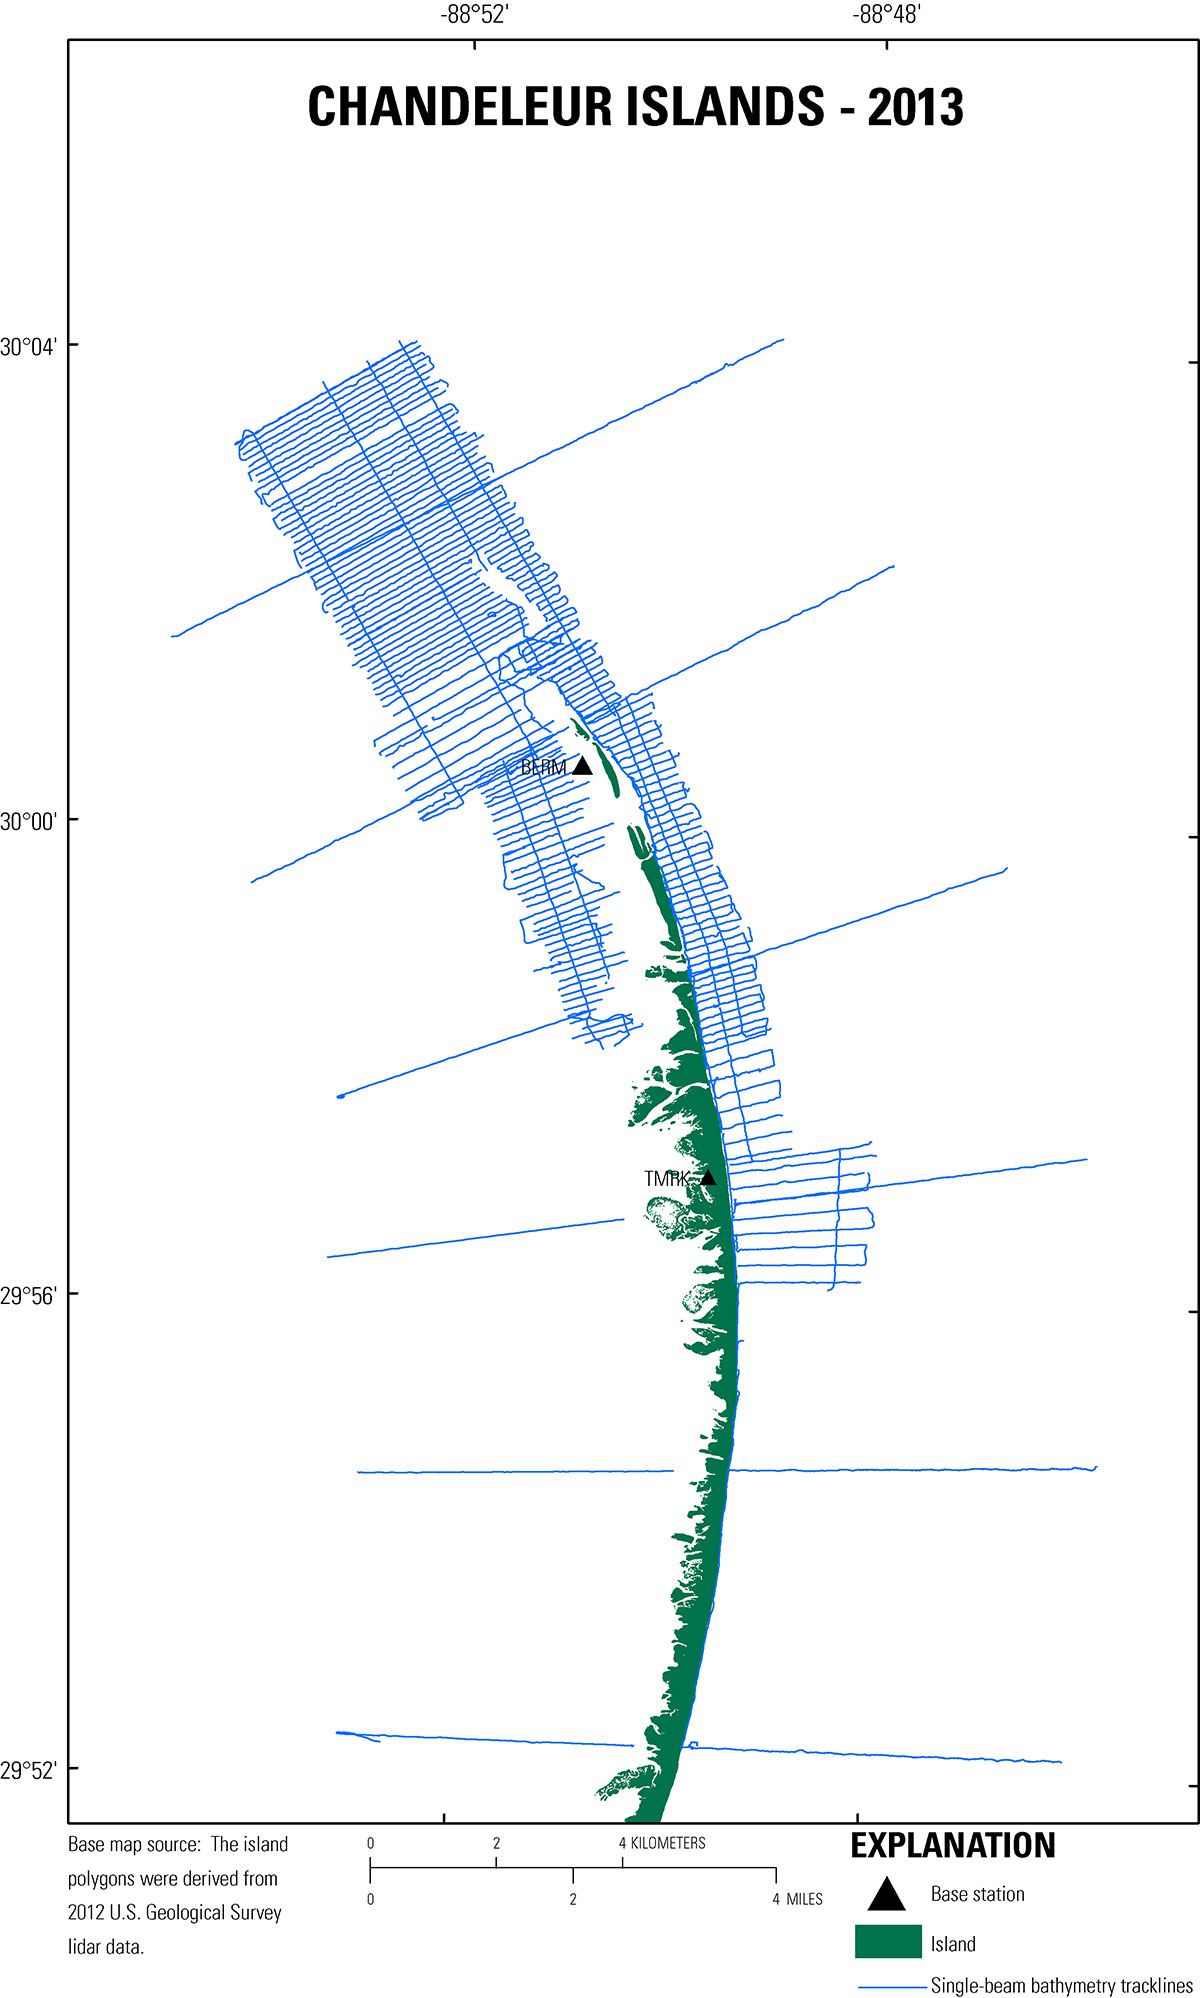
Figure 8. Trackline map coverage showing the 429 line-km (246 lines) of single-beam bathymetry data collection. The island area extent is derived from U.S. Geological Survey light detection and ranging (lidar) collected in 2012 (Guy and others, 2014). [Click to enlarge] |
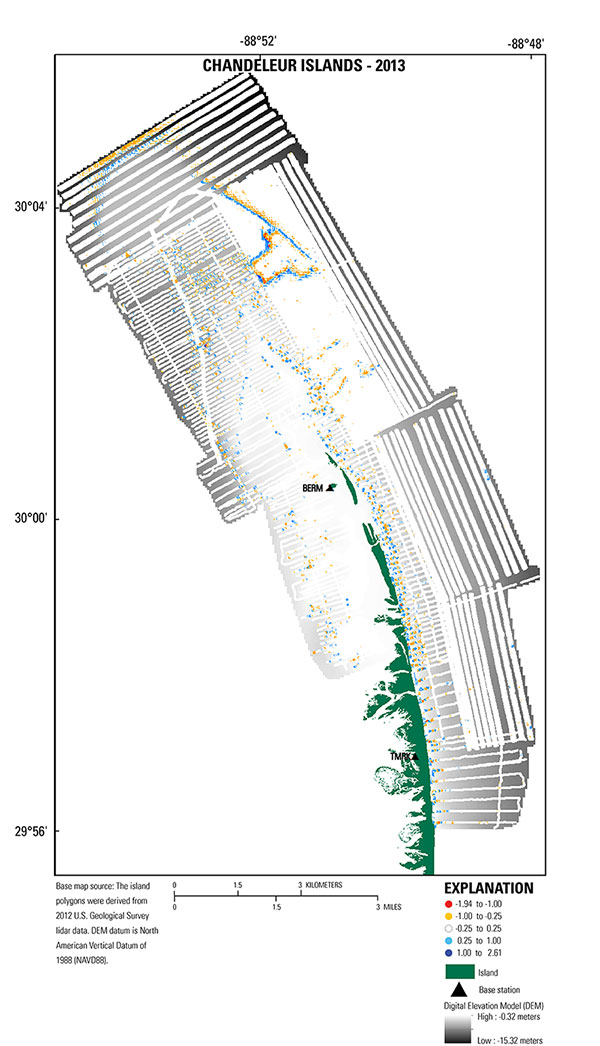
Figure 12. Map showing error values (white circles) overlain upon the bathymetry grid (DEM), representing the difference between the bathymetry grid and each sample point (for positive values, the grid is deeper than the soundings; for negative values, the grid is shallower than soundings). White circles represent error of ± 0.25 meters. The island area extent is derived from U.S. Geological Survey light detection and ranging (lidar) collected in 2012, (Guy and others, 2014). [Click to enlarge] |
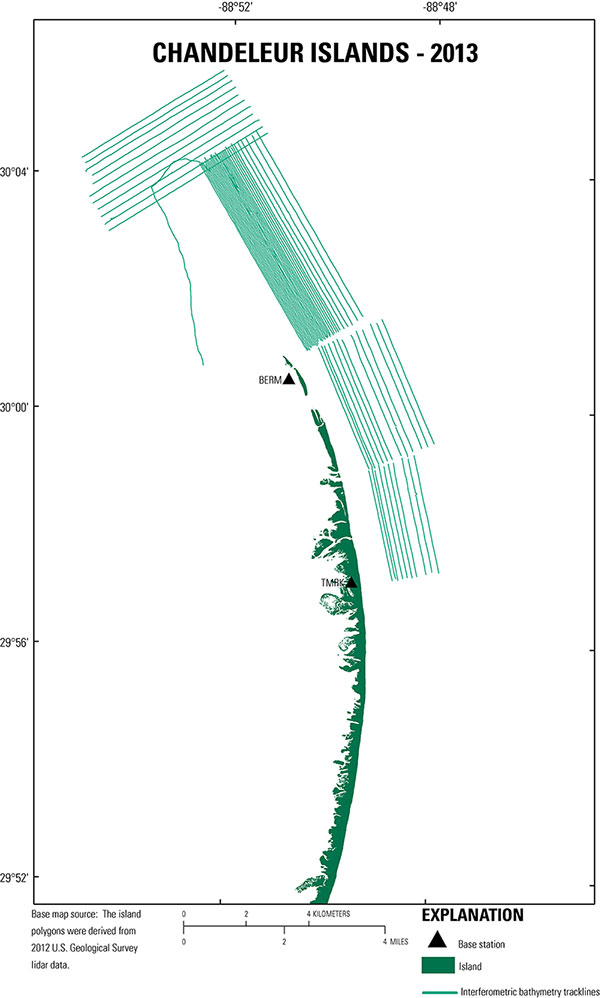
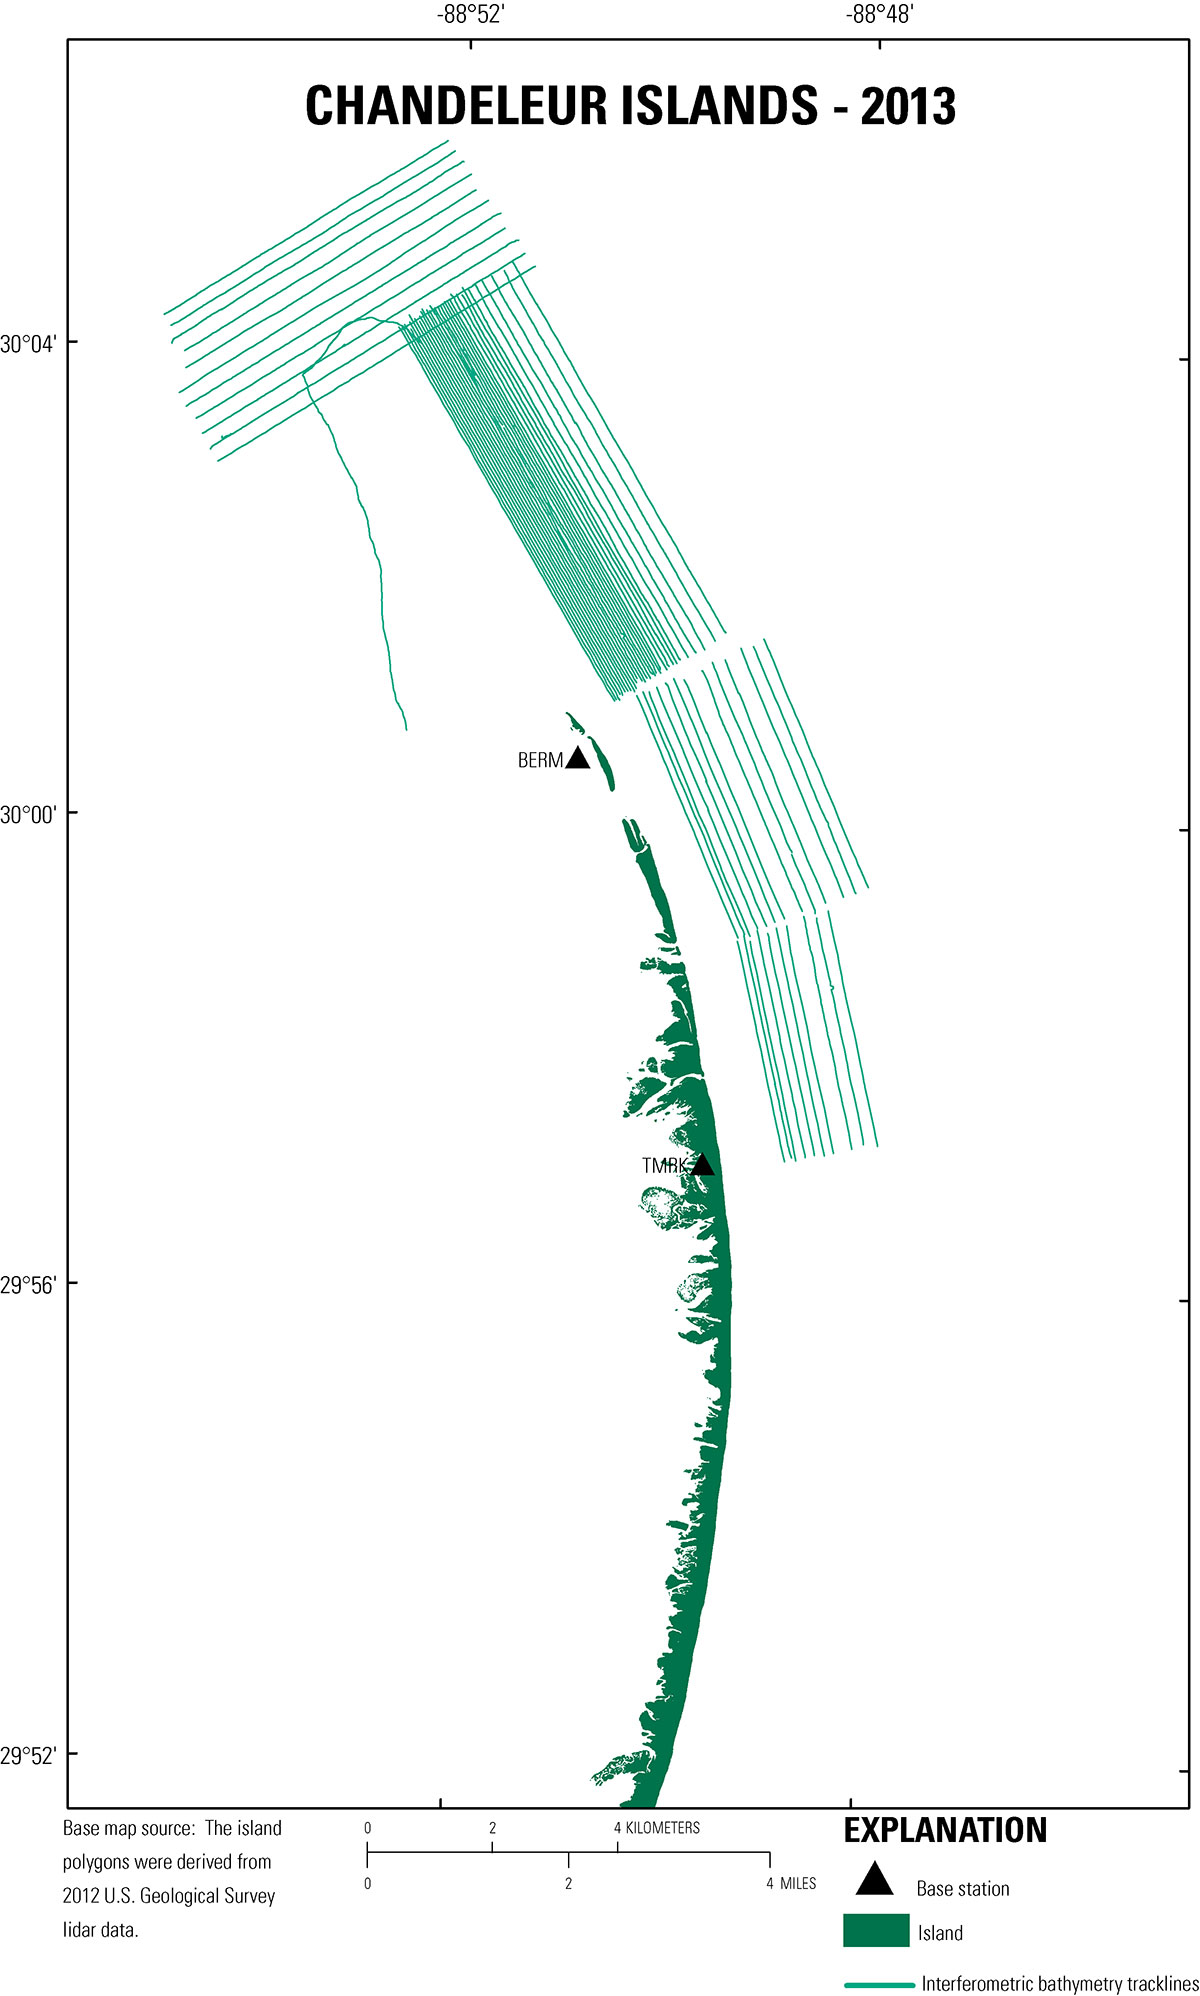
Figure 10. Trackline map coverage showing the 375 line-km (98 lines) of interferometric swath bathymetry data collection. The island area extent is derived from U.S. Geological Survey light detection and ranging (lidar) collected in 2012 (Guy and others, 2014). [Click to enlarge]
|
|
|