Data Series 1049
| Data AcquisitionNavigationThe horizontal and vertical positions of each single-beam sounding and ground-based GPS point were collected using a base-rover configuration with data recorded at 10 Hertz (Hz) using Ashtech ProFlex 500 Global Navigation Satellite System (GNSS) receivers with Thales choke ring (CR) antennas. A total of three stationary base locations were occupied during the surveys: (1) National Geodetic Survey (NGS) benchmark U374 (Permanent Identification (PID) number KU0206), (2) a National Park Service benchmark near the town of Robins Rest, N.Y. (REST, see Henderson and others, 2015), and (3) a USGS benchmark near the National Park Service Wilderness Visitor Center (VC), (Brownell and others, 2015). The base at benchmark U374 collected data continuously on each survey day and was equipped with an Inmarsat Broadband Global Area Network (BGAN) satellite uplink system for remote monitoring of the base station (fig. 5). The station consisted of an Ashtech Proflex 500 GNSS receiver and an Ashtech CR antenna. The base station at REST was only assembled during collection of western transects and was occupied with an Ashtech Proflex 500 with an Ashtech CR antenna. A backup base station was assembled at VC (used on May 13 and May 19, 2015) and was composed of an Ashtech Proflex 800 and an Ashtech CR antenna. GPS data acquired by the PWCs, the backpack, and the base stations were downloaded at the end of each survey day. A small segment of the U374 data was downloaded via the BGAN network nightly to ensure the system was operating properly; the full dataset was collected when access to the site was permitted. 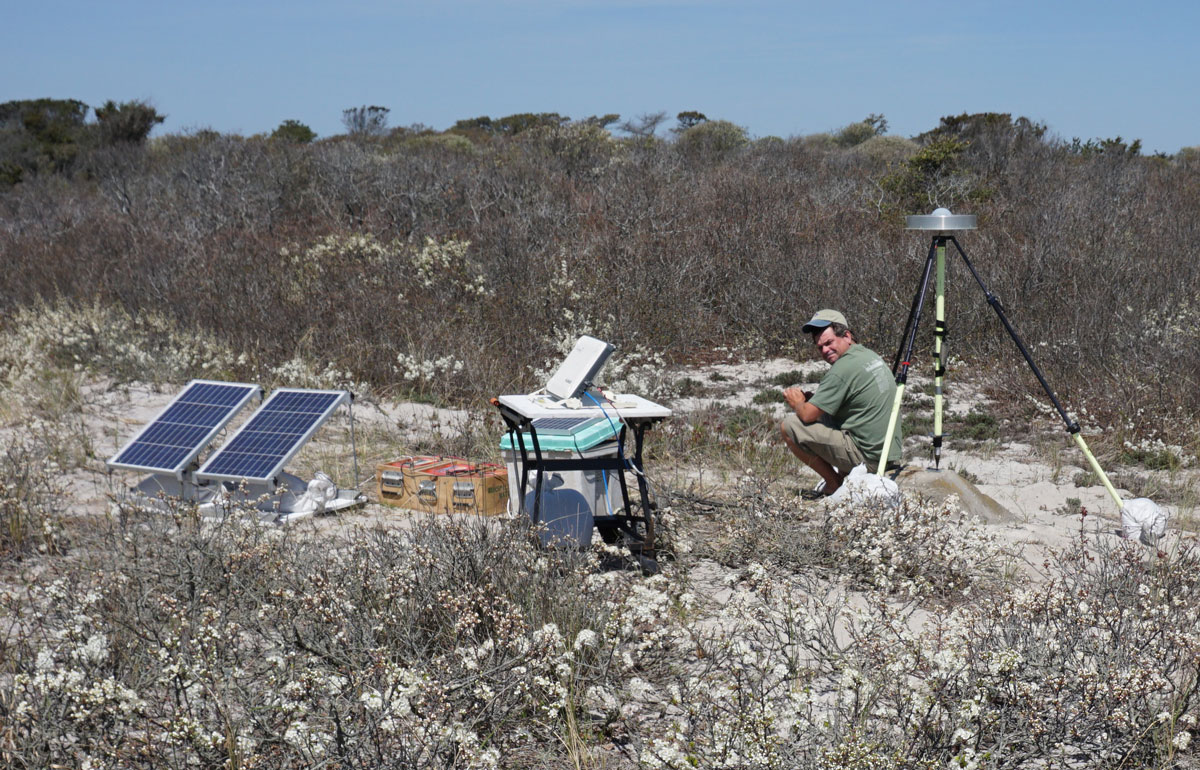 Figure 5. Base station at benchmark U374 showing the Broadband Global Area Network satellite uplink (center), solar panels and battery packs (left) and Global Positioning System antenna (right). [Click image to enlarge] Single-Beam SonarNearshore bathymetry was measured using single-beam sonar systems and GPS receivers mounted on two PWCs (fig.6). The PWCs used were a 2010 (PWC1) and 2013 (PWC2) Yamaha VX Deluxe. Each PWC was fitted with a single-beam transducer mounted off the starboard stern below the waterline and placed 1.23 m and 1.30 m beneath the GPS antenna, for PWC1 and PWC2, respectively. A waterproof Pelican case attached to the stern of each PWC contained a Cappuccino personal computer (PC), Teledyne Odom Ecotrac CV100 Digital Hydrographic Echo Sounder, and an Ashtech Proflex 800 GNSS (fig. 6). The system was powered by a marine battery located in the front storage compartment of the PWC, and the user interface included a waterproof display, waterproof keyboard, and a mouse. 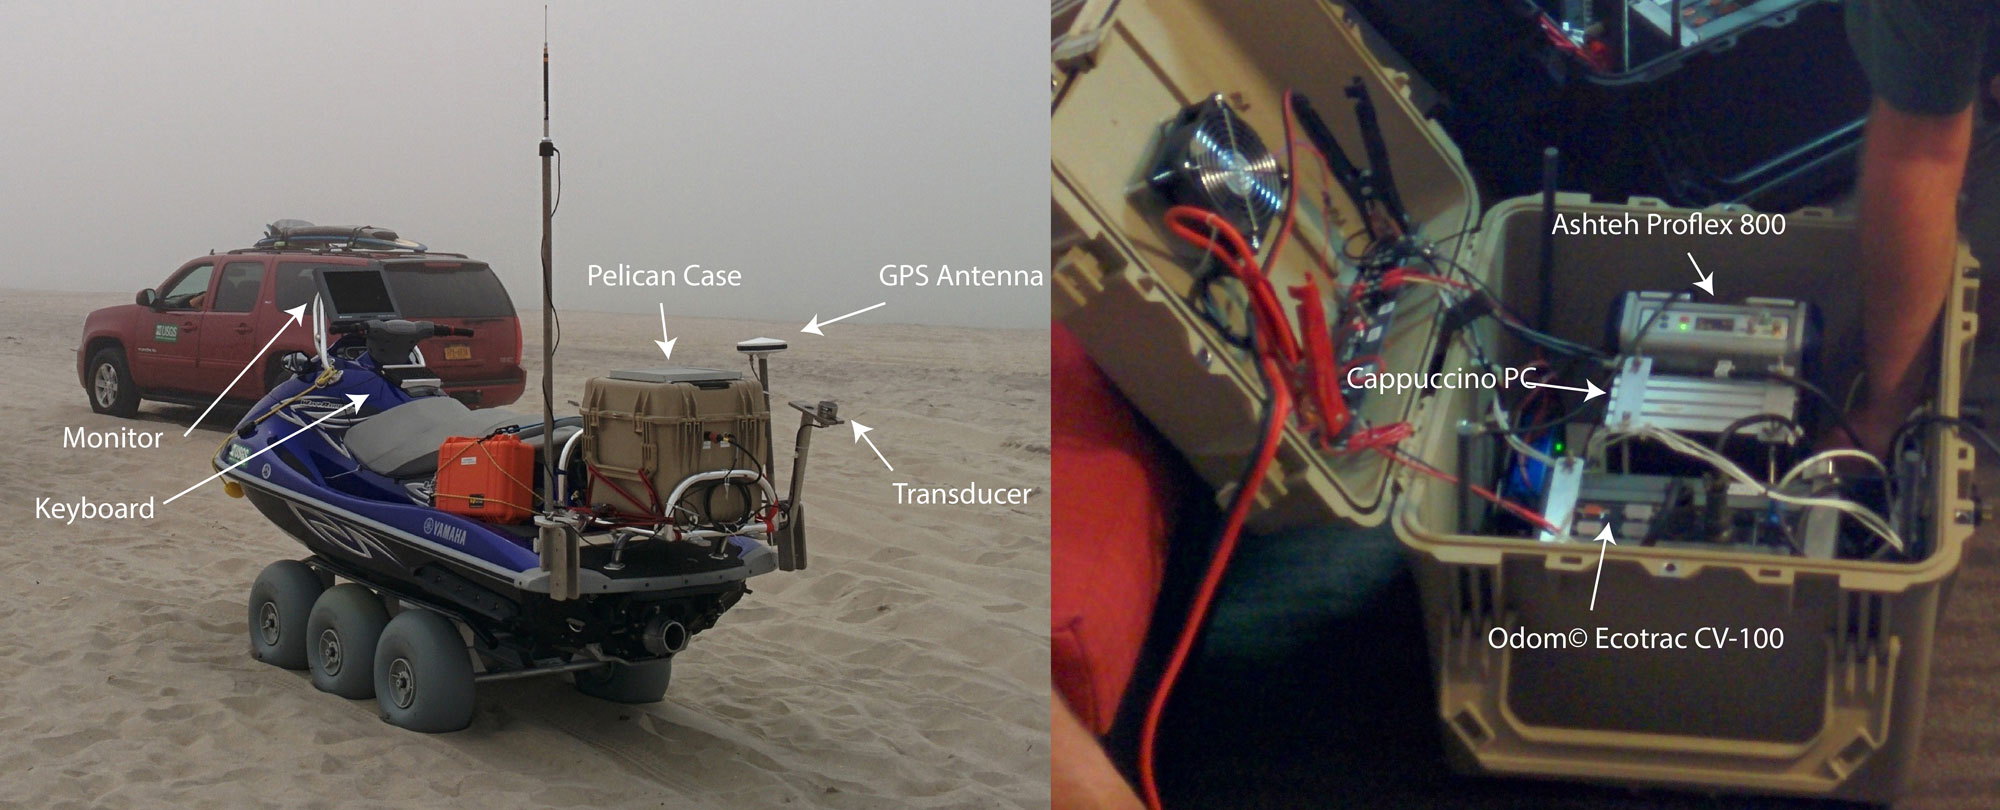 Figure 6. Personal watercraft instrument configuration (left) and Pelican case hardware configuration (right). [Click image to enlarge] The sonar system used a 200 kilohertz (kHz) single-beam transducer and recorded digitized, raw, acoustic backscatter returns with a vertical resolution of 0.01 m +/-0.1 percent depth. A 4-degree transducer was used on PWC1 while a wider beam nine-degree transducer was used on PWC2. Different transducers were used due to equipment failure in the field. HYPACK navigation and data acquisition software recorded the depth soundings and GPS locations at 10 Hz to a raw data file (.raw) and a binary file (.bin) containing the return intensity in realtime from the Odom Echotrac CV100. PWC operators followed predefined tracklines using a HYPACK map interface, which displays the position of the vessel in realtime. Within the wilderness breach, planned lines were followed when possible; however, the abundant shoals required operators to follow deeper tidal channels as opposed to planned lines (fig. 4). Supplementary soundings were collected within the breach flood channels to obtain high-resolution control over channel boundaries where large depth changes occurred. Ground-Based MappingElevation data were collected using two Ashtech Z-Xtreme GPS receivers mounted in SECO backpacks with Ashtech Marine antennas attached to a pole extended above the head of the surveyor. The elevation of the antennas relative to the ground was measured for each surveyor in a walking stride position (varying between 2.07 and 2.10 m). The surveyors did not follow a pre-defined path but collected data over as much of the subaerial and shallow shoals and beach as possible during low tide (fig. 7). 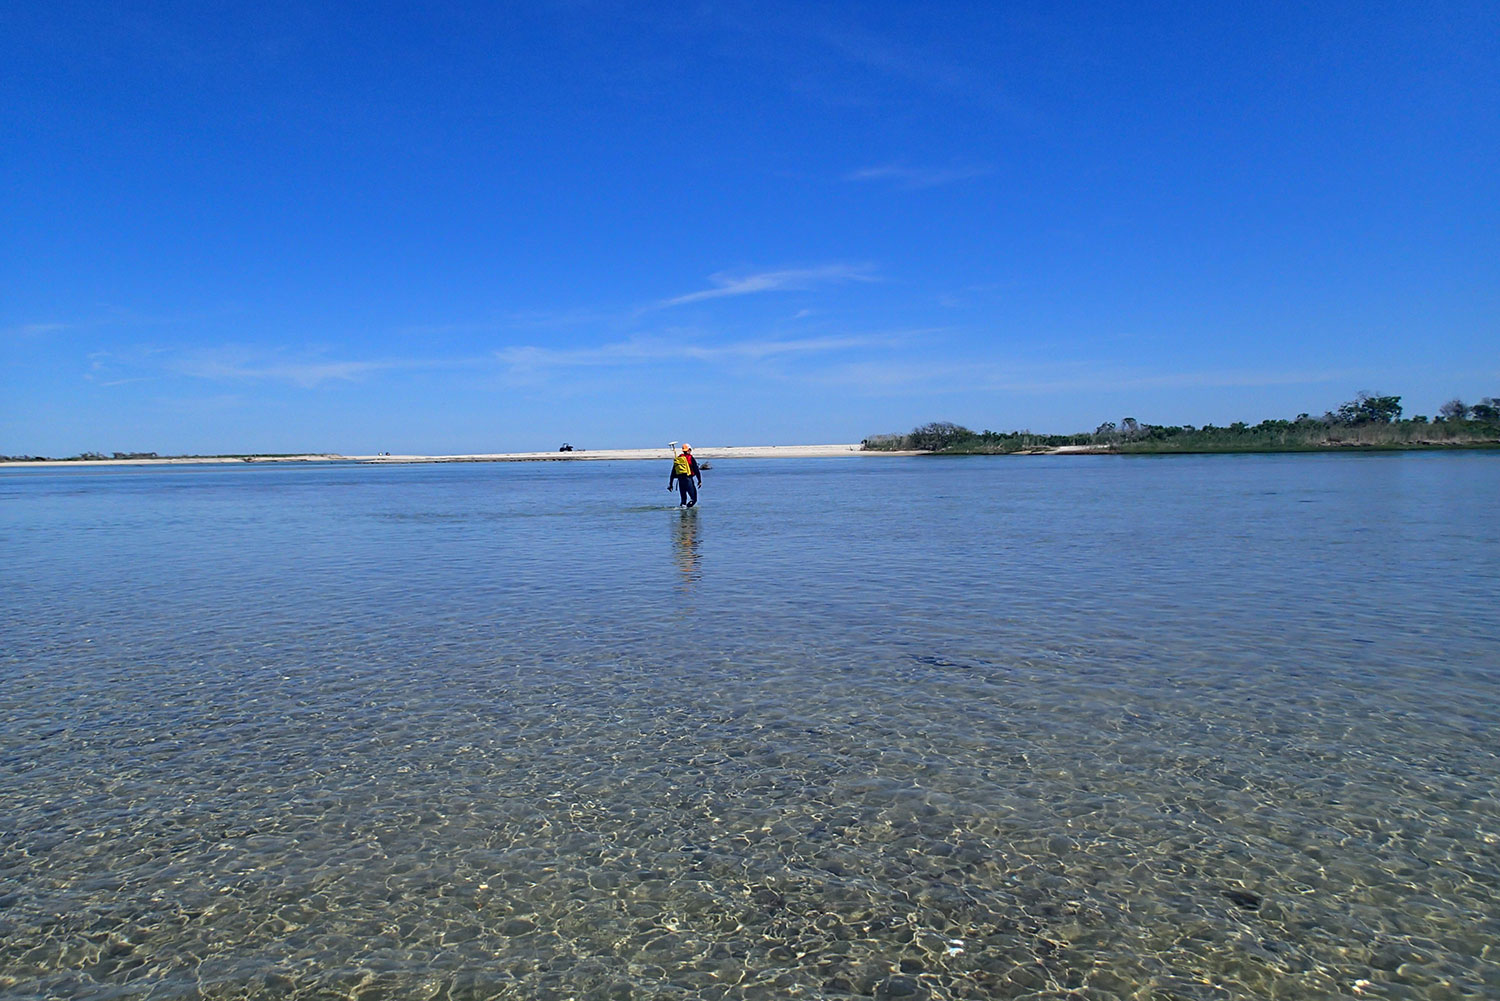 Figure 7. Flood shoal and shallow channel elevation collection using a backpack Global Positioning System within the wilderness breach. [Click image to enlarge] Sound VelocityAccurate sound velocity measurements are required to correct sounding errors due to density gradients throughout the water column. Water column sound-velocity measurements were collected periodically throughout the survey using a SonTek CastAway Conductivity, Temperature, and Depth (CTD) instrument. Data were processed using SonTek CastAway CTD software version 1.5. |

![]() U.S. Department of the Interior |
U.S. Geological Survey
U.S. Department of the Interior |
U.S. Geological Survey
URL: http://pubsdata.usgs.gov/pubs/ds/1049/ds1049_data-acquisition.html
Page Contact Information: GS Pubs Web Contact
Page Last Modified: Thursday, 11-May-2017 09:22:15 EDT
