Data Series 1049
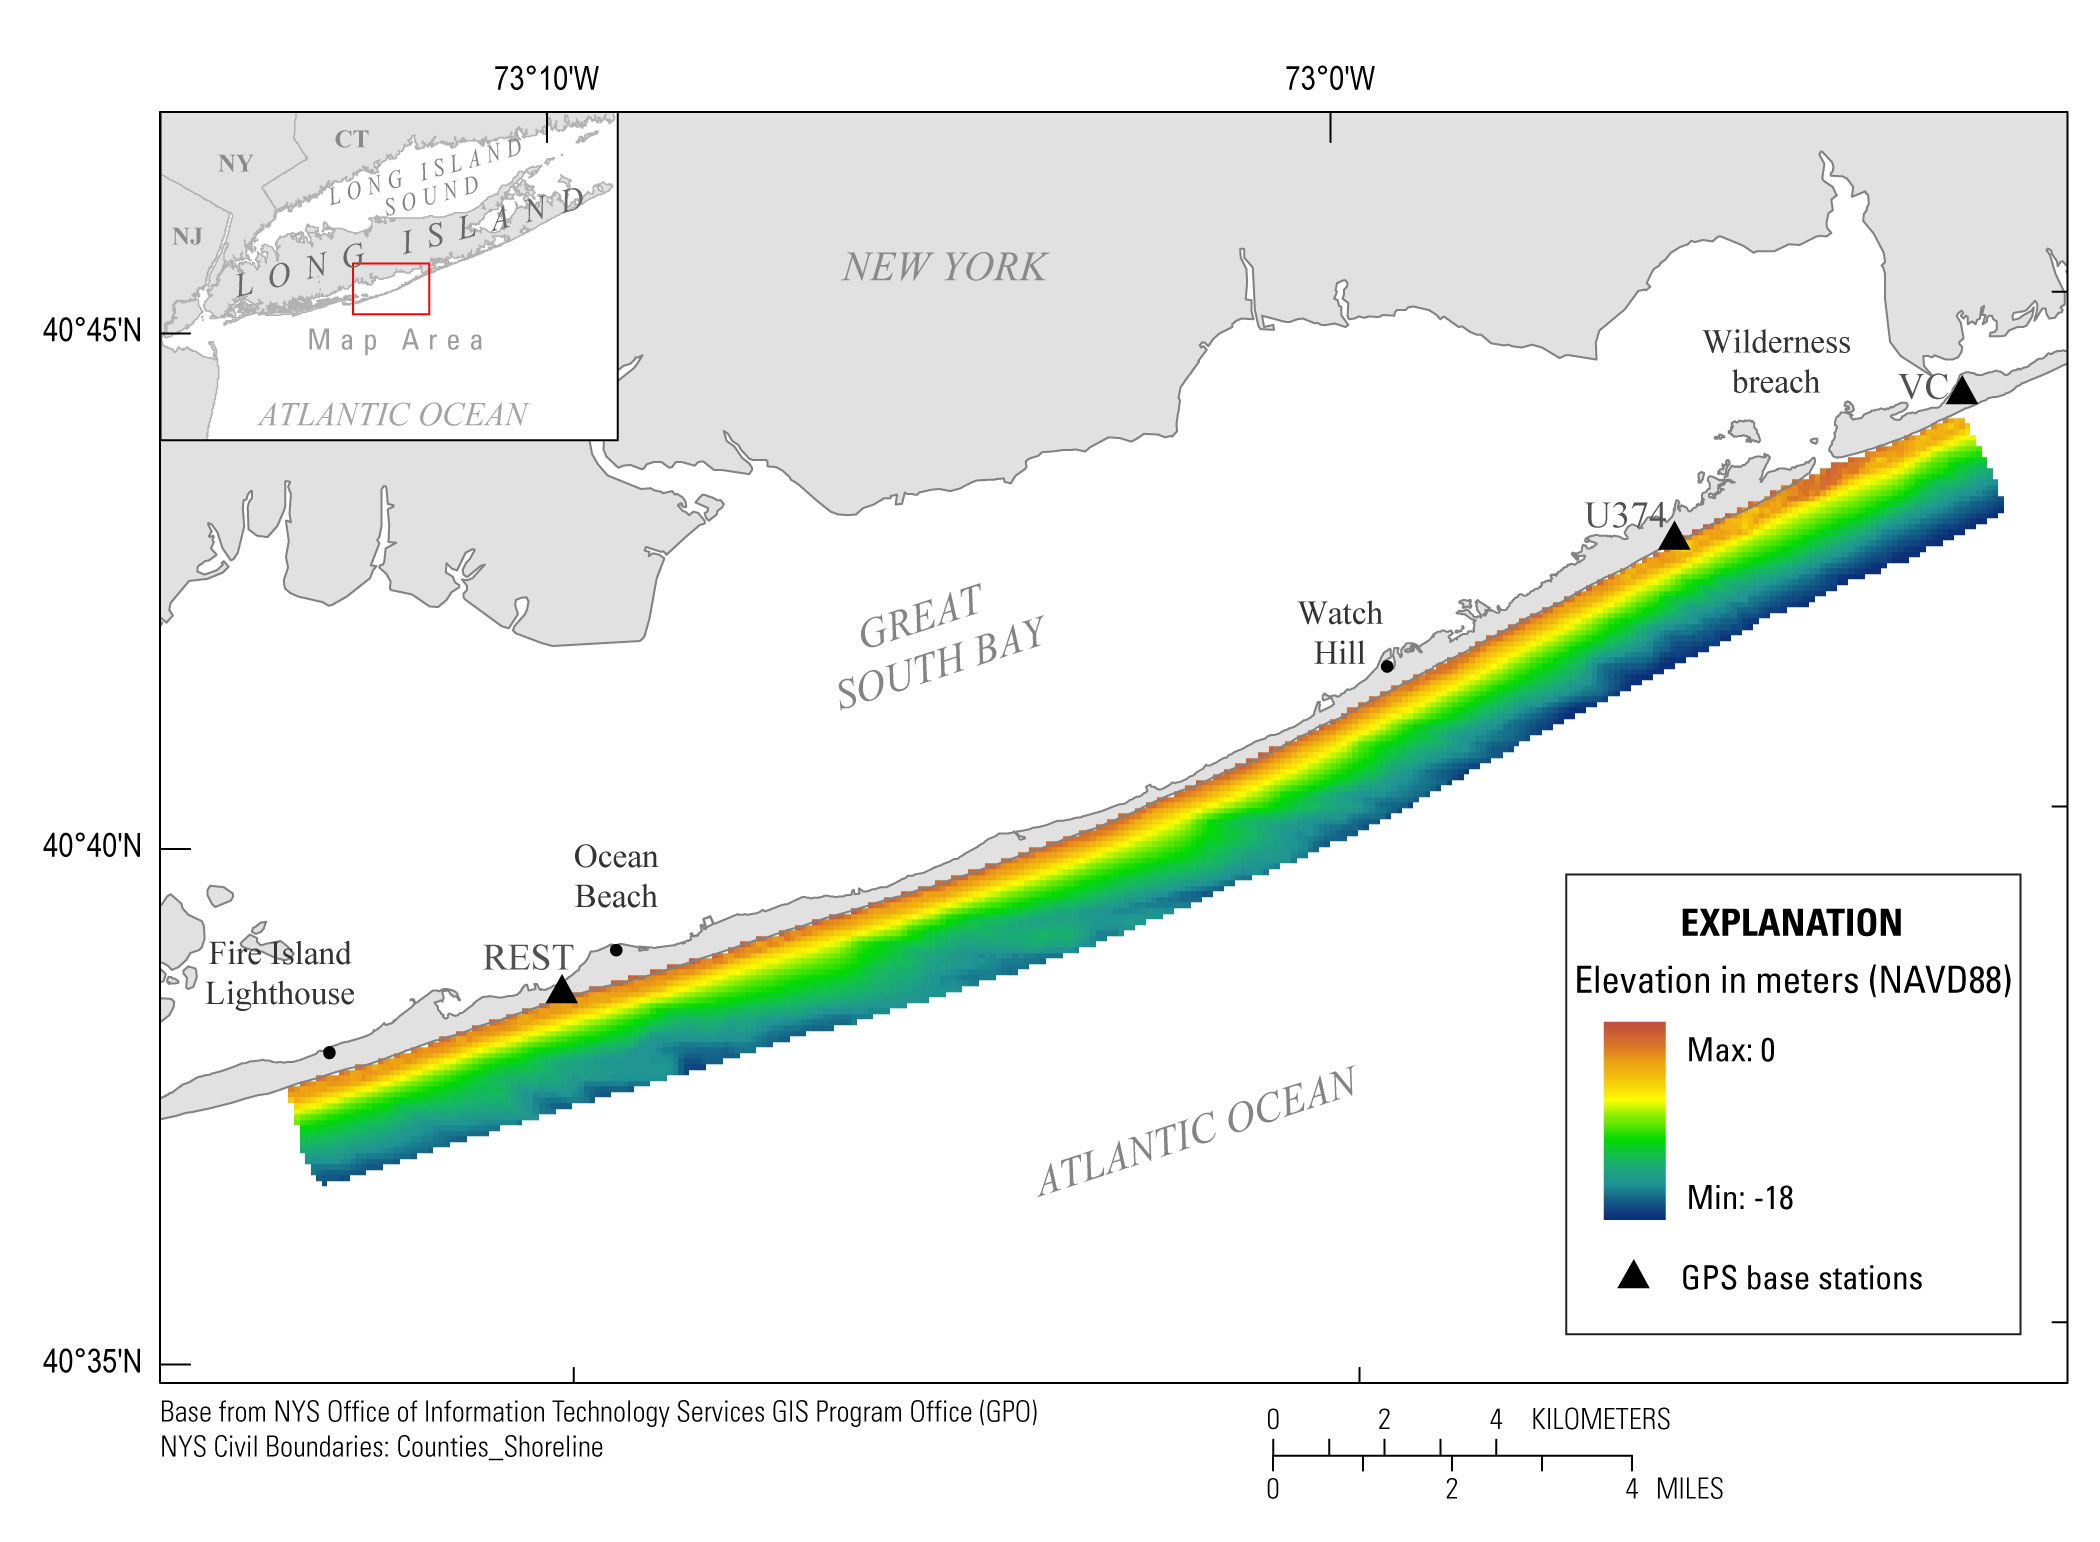
| Data ProcessingNavigation DataHorizontal and vertical coordinates associated with each sounding were postprocessed using differential corrections derived from the base/rover setup. Three GPS reference stations, located at benchmarks REST, U374, and VC (fig. 2), were used for the survey. Reference station coordinates were verified against known coordinates with Continuously Operating Reference Stations (CORS) using the Online Positioning User Service (OPUS http://www.ngs.noaa.gov/OPUS/). OPUS reported horizontal errors of 0.40 centimeters (cm) for REST, 0.50 cm for U374, and 0.30 cm for VC. Vertical errors were 0.20 cm for REST, 0.30 cm for U374, and 1.50 cm for VC. After applying the reference station coordinates, GPS data acquired from the rover were processed to the concurrent GPS session data at the base station using GrafNav software (Waypoint Product Group) version 8.5. The horizontal and vertical coordinates were recorded in the World Geodetic System of 1984 (WGS84) reference frame during acquisition and exported from GrafNav as American Standard Code for Information Interchange (ASCII) files for the single-beam trajectory data. The postprocessed ground-based elevation trajectory data were converted within GrafNav to North American Datum 1983 (NAD83(2011)) and North American Vertical Datum of 1988 (NAVD88), referenced to the GEOID12A model, and exported as ASCII files. Single-Beam DataSingle-beam soundings were merged with differentially processed GPS data and sound velocity profiles using Matlab (2015b). Each transect was visually inspected for elevation outliers and dropouts associated with wave-breaking in the surf zone and corrected manually. Usually, the highest intensity return is generated by the surface of the seafloor. Breaking waves in the surf zone can create air bubbles in the water column and cause an erroneous peak in waveform intensity. Errors are then produced in the interpreted seafloor reflection. When this circumstance was suspected, a corrected seafloor elevation was manually digitized by analyzing the .bin data file, which contains the complete waveform trace recorded by the Odom. The soundings were then corrected for the speed of sound (table 1) associated with the mean water temperature and salinity. A moving-average filter was then applied to the soundings to reduce instrument noise and the depth variations associated with the pitch and roll of the PWC. The depth soundings (from the transducer to the seafloor) were then adjusted to the depth reading from the GPS antenna and subsequently to the WGS84 ellipsoid; referencing to the ellipsoid reduces the error associated with determining mean water level and (or) tidal elevations. The National Oceanic Atmospheric Administration (NOAA) VDatum software version 3.3 converted the horizontal and vertical coordinates to NAD83 and NAVD88 (GEOID12A), respectively.
Table 1. Daily sound velocities in meters per second (m/s)
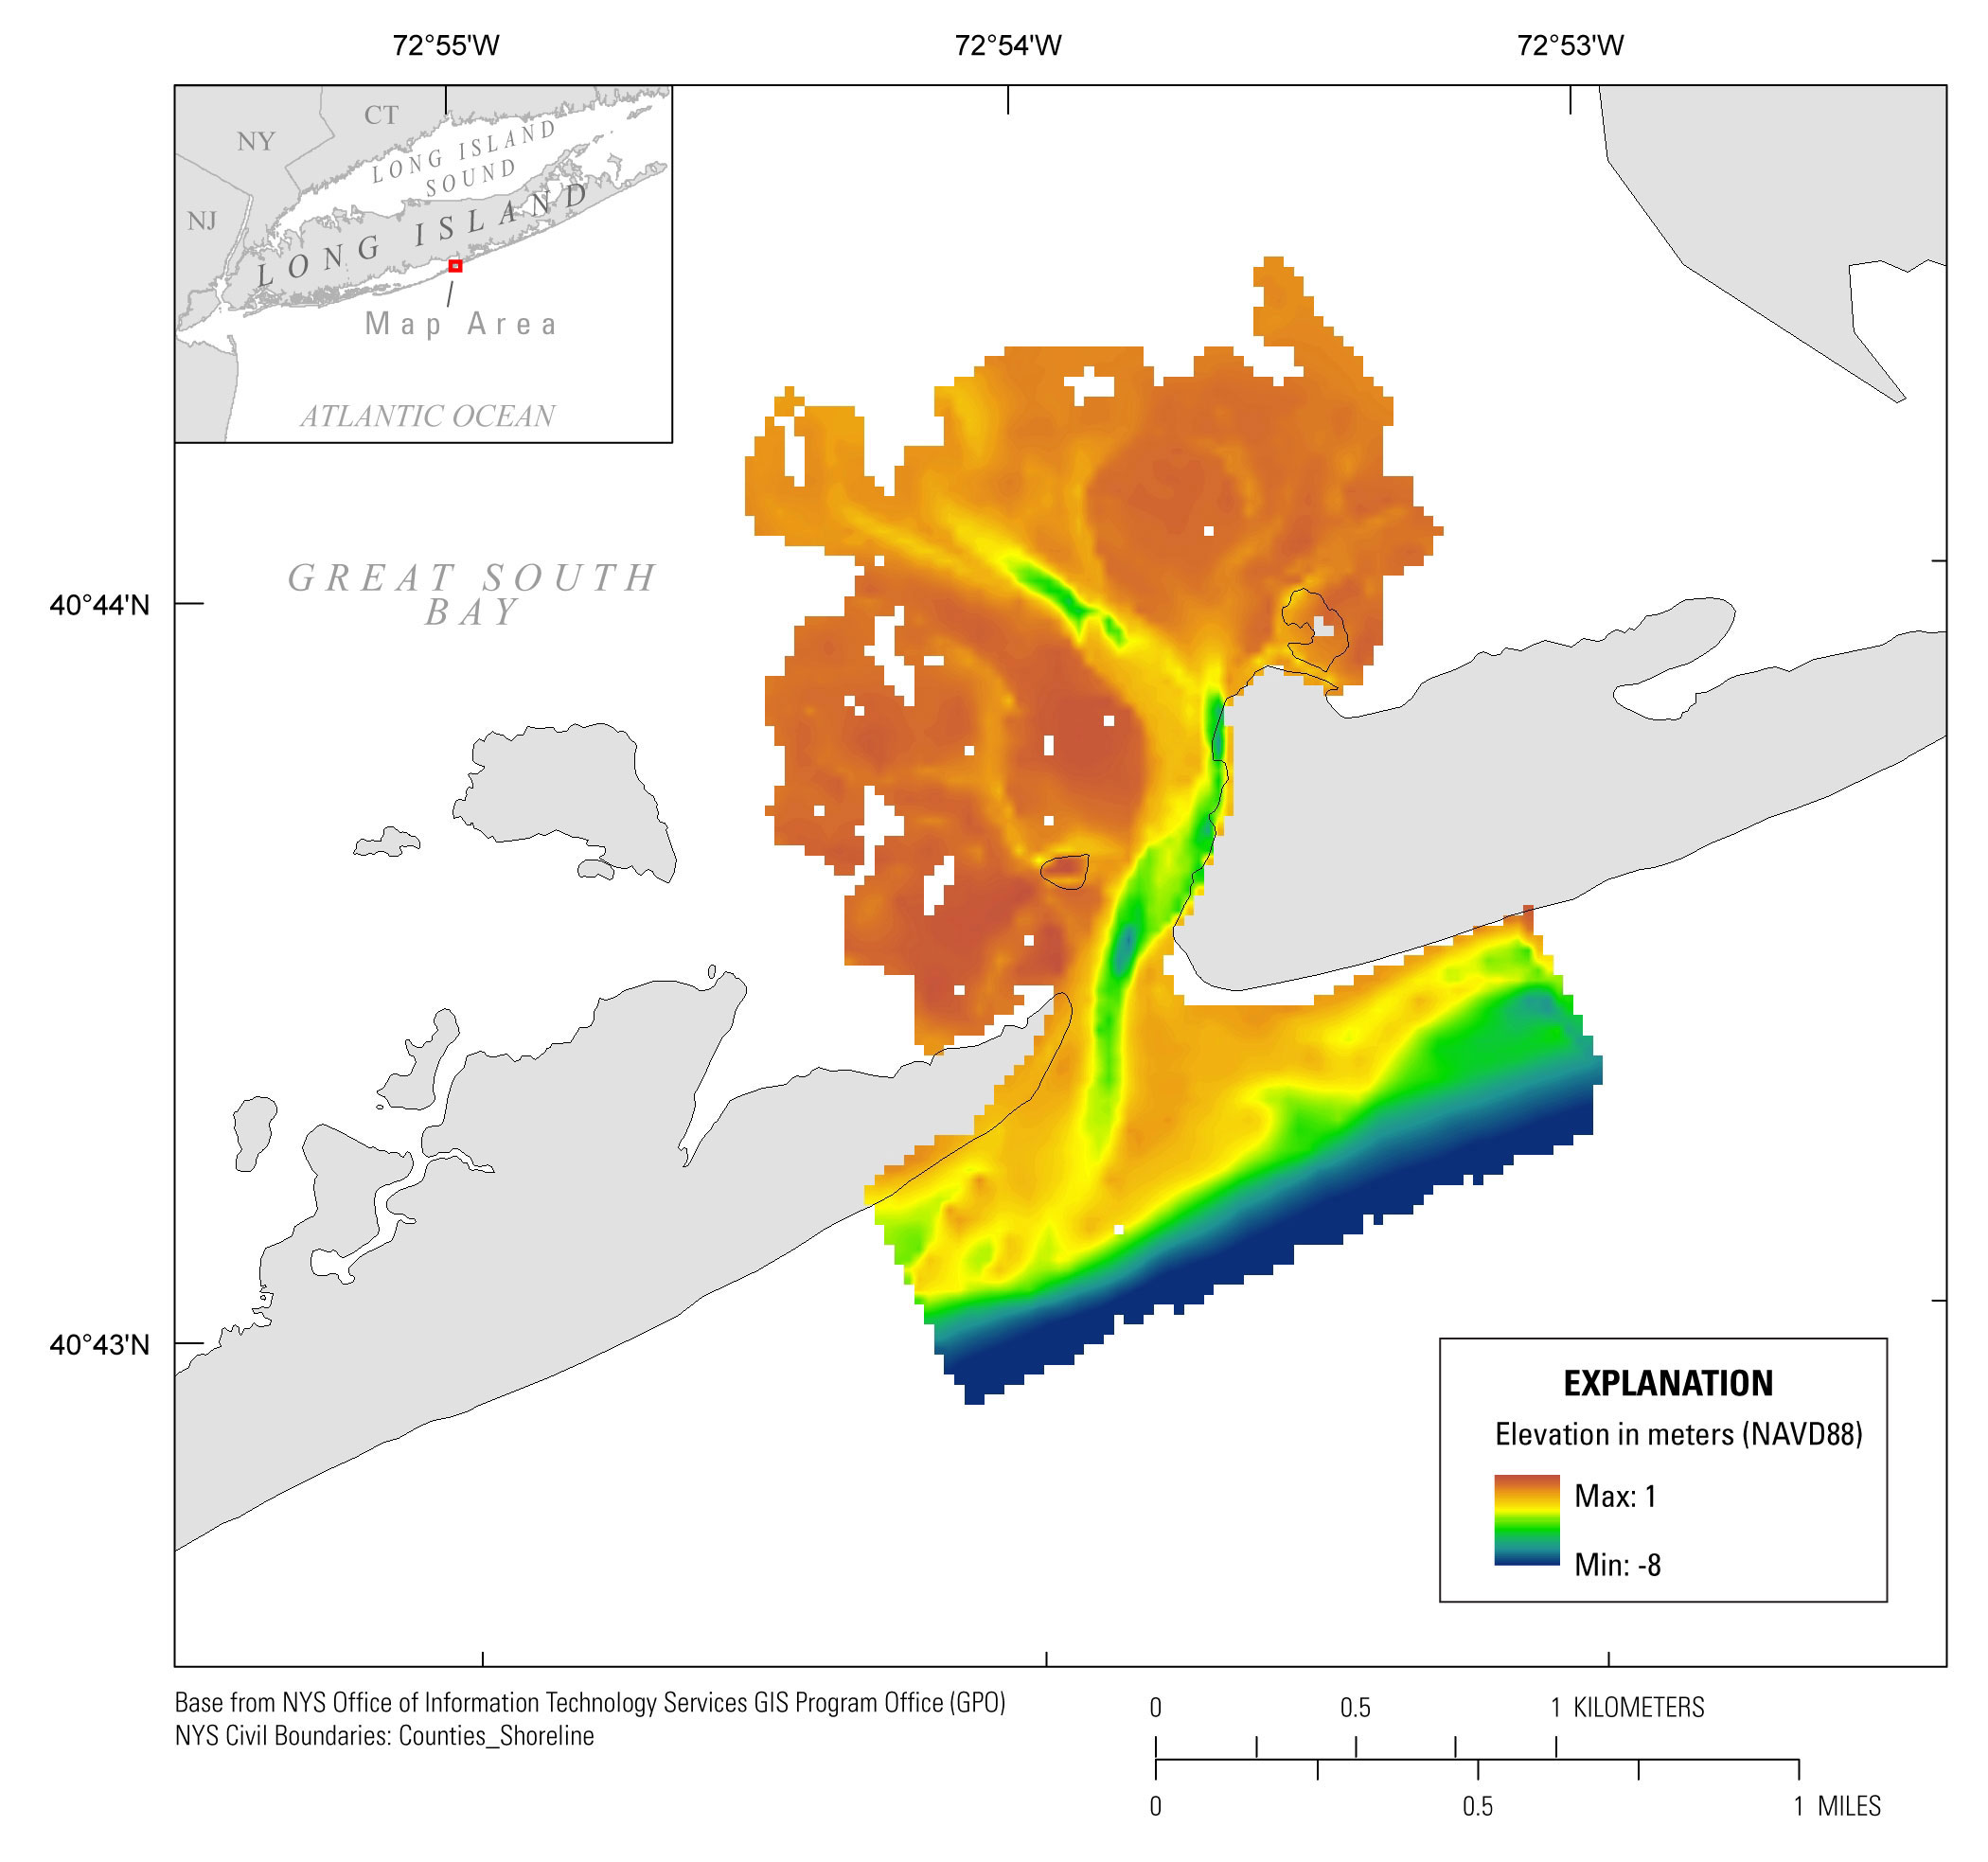
The accuracy of the single-beam soundings was evaluated by identifying locations where survey tracklines crossed, and soundings from each line were within a horizontal distance of 0.25 m of each other. Evaluation of the trackline crossings indicated there was a root mean square (RMS) vertical uncertainty of 18.3 cm with a 1-cm bias between the two PWCs. Large elevation differences often appear near channels where elevations vary rapidly over short distances. The RMS error for PWC2, when crossing a trackline it previously surveyed, was 13.0 cm. When PWC1 crossed a trackline it previously surveyed, the RMS error was 16.8 cm. Since the bias between the PWC elevations was on the order of the Odom instrument accuracy (1 cm +/- 0.7 percent depth), no adjustments were made. The transformation that occurred in the conversion from the WGS84 ellipsoid to NAVD88 (GEOID12A) (http://vdatum.noaa.gov/docs/est_uncertainties.html) resulted in a total 5.4-cm error. Applying the square root of the sum of the squares of the datum conversion uncertainty from all crossings (16.9 cm) resulted in a combined vertical error of 17.7 cm. Horizontal uncertainty is assumed to be half of the vertical uncertainty (8.9 cm) at most. Ground-Based DataErroneous ground-based horizontal and vertical positions, such as those that occurred when the surveyor took off the backpack and was transported between shoals, were removed. The vertical error associated with the remaining elevation data was calculated by segmenting temporally sequential elevations into 10-minute segments and identifying crossings between segments where an elevation was within at least 0.25 m. The calculated RMS of those intersections is 8.5 cm. Elevation differences between the ground-based and single-beam data points indicated the ground-based elevations were 1.8 cm higher than elevations recorded using PWCs. Given the high degree of uncertainty arising from variations in the stride of the backpack surveyor over a subaqueous surface, the data were adjusted to the single-beam elevation at the crossings. Digital Elevation ModelThe fully processed and corrected bathymetric data points (x,y,z) were separated into two regions; the wilderness breach and the shoreface; with the wilderness breach ebb-tidal delta located in both regions. The Fire Island shoreface data points consist solely of single-beam data while the wilderness breach data points include single-beam and ground-based data. The bathymetric data points were exported as ASCII files from Matlab. Data points for the wilderness breach and the shoreface were converted to an ArcGIS shapefile using the “create feature class from the xy table” tool in ArcCatalog version 10.2.2. The resulting point shapefiles were then used to create a triangulated irregular network dataset (TIN) for the shoreface and the wilderness breach using the “create TIN” tool. A raster dataset was created from the TIN using a 100-m cell size with a natural-neighbors interpolation for the shoreface (fig. 8) and a 25-m cell size for the wilderness breach TIN (fig. 9) using the “TIN to raster” tool. Due to the removal of erroneous lines and the inability to survey certain lines in the field, some interpolated grid cells are more than two cell sizes away from a sounding. When a cell was more than two cell sizes away from a data point, the cell was set to null and appears as a gap in the DEM. The method of Lentz and Hapke (2011) and Lentz and others (2013) were used to determine the uncertainty associated with the DEMs: 10 percent of the data points were withheld when creating the TIN using the ArcGIS “subset features” tool. The raster was then sampled using ArcGIS “extract values to points” tool at the corresponding eastings and northings of the withheld data. An RMS error between the sampled DEM and the measured value was found to be 20 cm vertically for the shoreface DEM and 25.2 cm vertically for the wilderness breach DEM.
|

![]() U.S. Department of the Interior |
U.S. Geological Survey
U.S. Department of the Interior |
U.S. Geological Survey
URL: http://pubsdata.usgs.gov/pubs/ds/1049/ds1049_processing.html
Page Contact Information: GS Pubs Web Contact
Page Last Modified: Thursday, 11-May-2017 15:13:49 EDT