 |
|
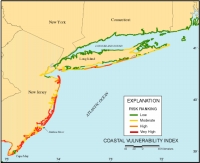 Figure 4. Map of the Coastal Vulnerability Index for the New York to New Jersey region. |
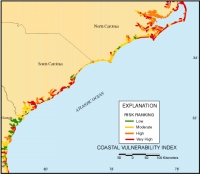 Figure 8. Map of the Coastal Vulnerability Index for the North Carolina to Georgia region. |
The data underlying the coastal vulnerability index (CVI) show variability at several spatial scales. The rate of sea-level rise, and tide range vary over a spatial scale of >100 km. In the case of sea-level rise, this represents the large-scale patterns of isostasy and tectonism present along the Atlantic continental margin of North America (Peltier, 1996; Braatz and Aubrey, 1987). Changes in tide range generally reflect changes in the configuration of the continental shelf as a whole (e.g., shelf width).
A second group of variables, consisting of geomorphology and wave height, vary on a ~10 km scale that reflects primarily the landward changes in environments and energy in the coastal system. For example, there is a nearly continuous chain of barrier islands backed by estuaries and lagoons along the open-ocean coast from eastern Long Island, New York to the Florida Keys.
The shoreline erosion/accretion rates vary on a spatial scale equal to the minimum size of our grid, which is 3 minutes or ~6 km. It is this variable which adds the greatest variation to the CVI values. As described above, this is also the variable in our data set that is the least well-documented.
Regional Examples
To highlight the nature of the CVI and its underlying data, different index variables from two geographic regions are presented on the next two pages:
| Previous Page | Contents | Back to Top | Title Page | Next Page |
| Introduction | Risk Variables |
Data Ranking |
CVI | Results | Discussion | Summary | References |
|
Web Page by
Donna Newman [an error occurred while processing this directive] |