 |
|
| ||||||||||||||||
|
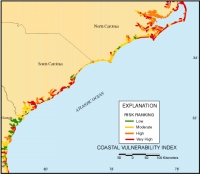
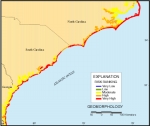
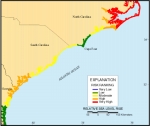
Along the North Carolina, South Carolina, and Georgia coasts the variability in the coastal vulnerability index (CVI) ranking (Figure 8) is more strongly influenced by different variables than the New York - New Jersey coast. Here, geomorphology is still the dominant variable (Figure 9). Variations in the CVI, however,are apparent due to the rate of relative sea-level change and wave height. The rate of sea-level change (Figure 10) is lowest at Cape Fear, North Carolina, due to long-term tectonic uplift of the mid-Carolina Platform High, also known as the Cape Fear Arch (Gohn, 1988). This factor places the risk due to sea-level rise for Cape Fear into the moderate category when other risk variables would give it a higher risk. The risk due to wave height varies between the north and south sides of Cape Hatteras and Cape Lookout (Figure 11), and generally decreases from Cape Hatteras southward into the Georgia embayment. This reflects differences in wave energy at two spatial scales. At the scale of each cape, there is a substantial difference in wave energy between the east-facing (high energy) and south-facing (lower energy) cape flanks. This is due in part to the orientation of the shoreline relative to the open Atlantic Ocean, and in part to the sheltering effect of the large sand shoals that extend several kilometers southeast from each cape (Heron et al., 1984). The decrease in wave energy from Cape Hatteras to Georgia is due primarily to the increasing continental shelf width in this region. |
||||||||||||||||
| ||||||||||||||||
| ||||||||||||||||
|