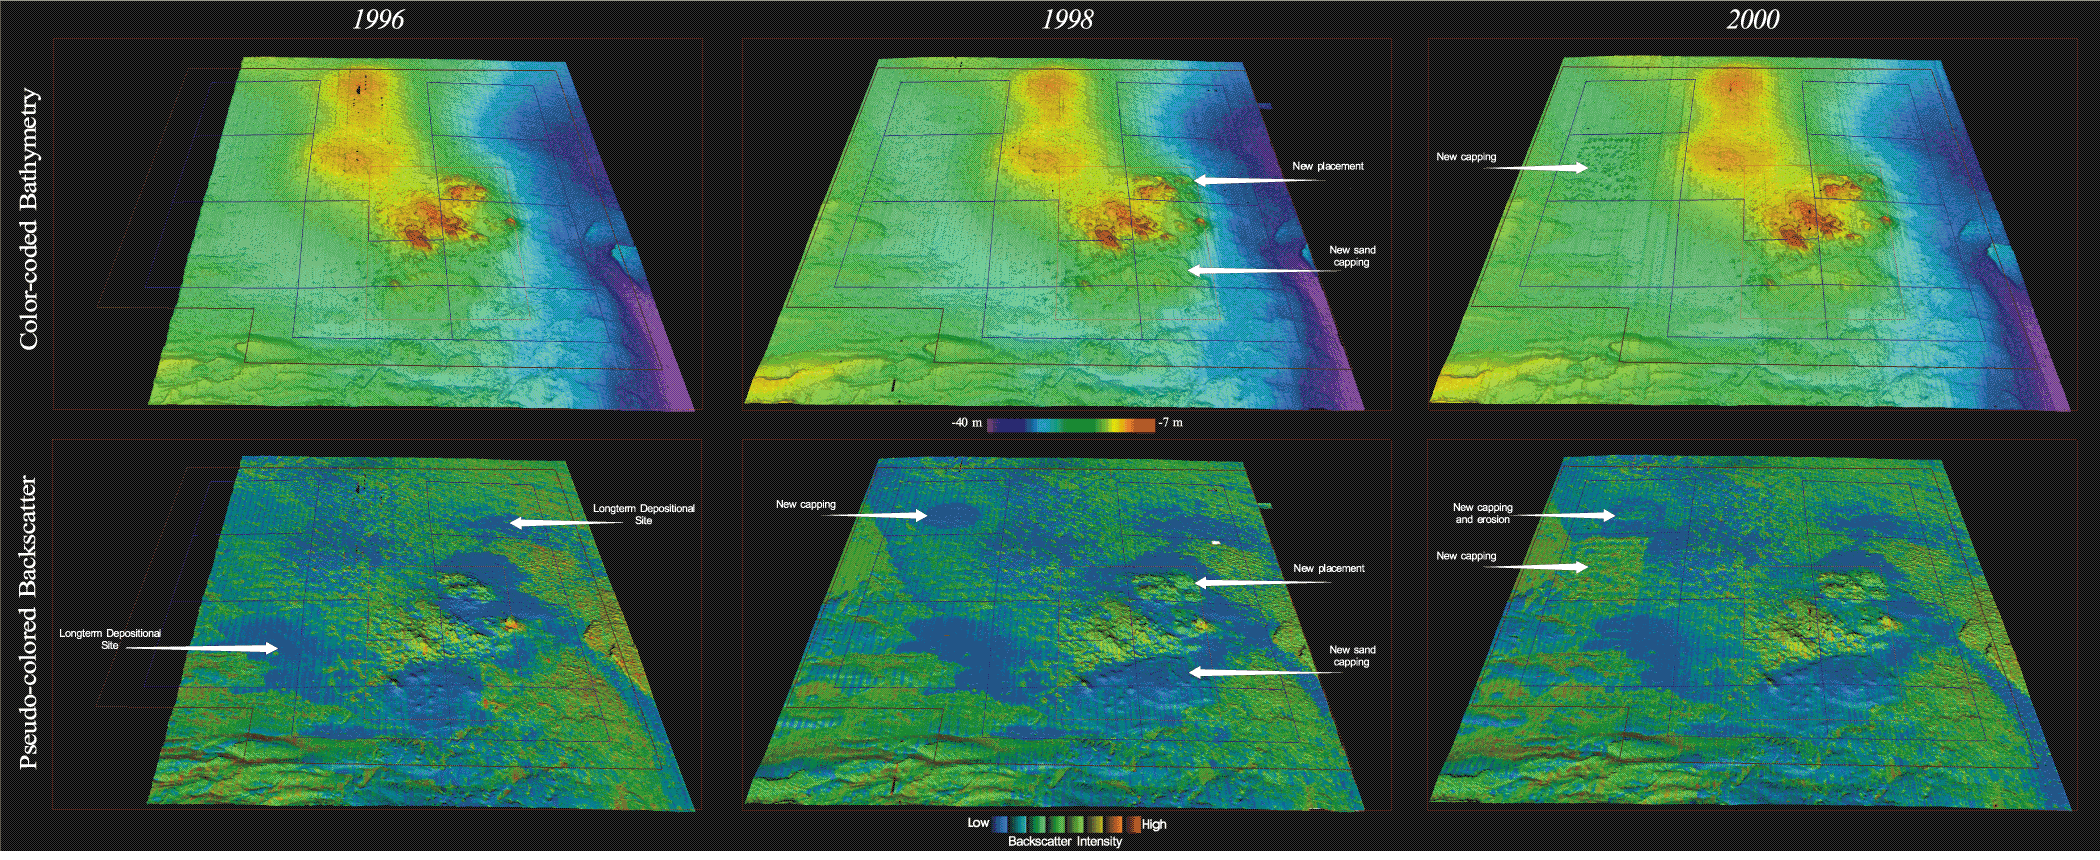
Figure 4. Perspective views of the Historic Area Remediation Site, looking from the south toward the north, for 1996 (left), 1998 (center) and 2000 (right).
Top: Shaded relief and color coded bathymetry. The shaded relief image was created by vertically exaggerating the topography four times and then artificially illuminating the relief by a light source positioned 45 degrees above the horizon from an azimuth of 350 degrees. The water depth, using a color scale from red (shallow) to purple (deep), is superimposed.
Bottom: Pseudo-colored backscatter intensity draped over shaded relief. In this image, the backscatter intensity is represented by a suite of eight colors ranging from blue, representing low backscatter intensity, to red, representing high backscatter intensity (see description of backscatter intensity in map section of text). These data are draped over the shaded relief image. The resulting image displays light and dark intensities within each color band resulting from a feature's position with respect to the light source. For example, north-facing slopes, receiving strong illumination, show as a light intensity within a color band, whereas south-facing slopes, being in shadow, show as a dark intensity within a color band.
Principal changes between 1996 and 1998 are the placement of new dredged material in the eastern part of the Mud Dump Site (MDS), capping in the southern part of the MDS, and placement in Primary Remediation Area (PRA#1) in the northwestern part of the HARS. The placement in PRA#1 appears as a circular area of low backscatter intensity material. Principal changes between 1998 and 2000 are increased backscatter intensity in PRA#1 due to additional placement of material and changes in the previous cover, and placement of new material in the western two-thirds of PRA#2. These new placements resulted in features that appear as craters 30 to 70 m long and on the order of 20 m wide, with the major axis oriented roughly north-south. The craters have elevated rims and depressions in the center and were apparently formed as the placed material impacted the soft sediments on the sea floor. Backscatter intensity is generally increased throughout the area surrounding the individual craters. The north-south stripes, running parallel to the survey tracklines, are artifacts of data collection and environmental conditions.