|
|
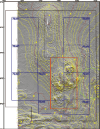
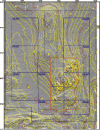
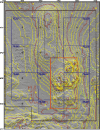
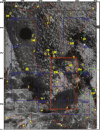
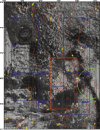
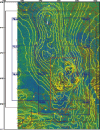
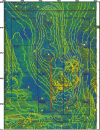
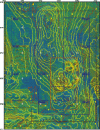
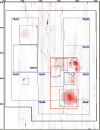
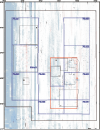
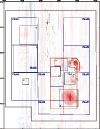
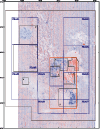
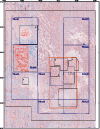
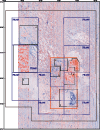
MapsThe topographic and backscatter intensity data are presented for the 1996, 1998, and 2000 surveys in Figures 5, 6, and 7 at a scale of 1:25,000. Each figure contains three maps: (a) shaded relief image overlain with 1 meter topographic contours, (b) gray-scale backscatter intensity overlain with 5 meter topographic contours and sediment texture properties, and (c) pseudo-colored backscatter intensity over a shaded relief image overlain and 1 meter topographic contours. Differences in topography and backscatter intensity are shown in Figures 8 and 9. Topography - shaded relief image (Figures 5a, 6a, 7a): The shaded relief image was created by vertically exaggerating the topography four times and then artificially illuminating the relief by a light source positioned 45 degrees above the horizon from the north. In the resulting image, topographic features are enhanced by strong illumination on the northward-facing slopes and by shadows cast on southern slopes. The image also accentuates small features (relief of a few meters) that could not be effectively shown as contours alone at this scale. Unnatural-looking features or patterns oriented parallel or perpendicular to survey tracklines (tracklines run north-south) are artifacts of data collection and environmental conditions. |
|||
|
|||
| Backscatter intensity (Figures 5b, 6b, 7b): | |||
|
The intensity of the acoustic return from the sea floor is a measure of the properties of the surficial sediments and of the bottom roughness. Generally, a strong return (light gray tones) is associated with rock or coarse-grained sediment, and a weak return (dark gray tones) with fine-grained sediments. However, the micro-topography, such as ripples, burrows, and benthic populations also affect the reflectivity of the sea floor. Direct observations, using bottom photography or video, and surface samples, are needed to verify interpretations of the backscatter intensity data. The backscatter data have a weak striping that runs parallel to the ship's track. Some of the striping is the result of poor data return at nadir that appears as evenly-spaced thin speckled lines. Some striping is also due to critical angle effects, where the intensity of return varies as a function of the angle of incidence of the incoming sound on the seafloor (Hughes-Clark and others, 1997). |
|||
|
|||
| Pseudo-colored backscatter intensity superimposed on shaded relief (Figures 5c, 6c, 7c): | |||
|
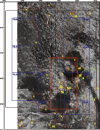
The acoustic backscatter intensity is combined with the topography to display the distribution of intensity in relation to the topography. In the images shown here, the backscatter intensity is represented by a suite of eight colors ranging from blue, which represents low intensity, to red, which represents high intensity. These data are draped over a shaded relief image created by vertically exaggerating the topography four times and then artificially illuminating the relief by a light source positioned 45 degrees above the horizon from an azimuth of 350 degrees. The resulting image displays light and dark intensities within each color band that result from a feature's position with respect to the light source. For example, north-facing slopes, receiving strong illumination, show as a light intensity within a color band, whereas south-facing slopes, being in shadow, show as a dark intensity within a color band. |
|||
|
|||
| Difference in topography and backscatter intensity (Figures 8 and 9): | |||
|
The difference in topography between 1996 and 1998 was computed by subtracting the water depths as measured in 1998 from the depths measured in 1996 (positive values indicate shallower water in 1998 compared to 1996) (Figure 8a). The differences in topography between 1998 and 2000 (Figure 8b) and between 1996 and 2000 (Figure 8c) were computed similarly. The change in backscatter intensity between the 1996 and 1998 survey was computed by subtracting the backscatter intensity in 1998 from the intensity in 1996 (negative values indicate increased backscatter in 1998 compared to 1996) (Figure 9a). The change in backscatter intensity between 2000 and 1998 (Figure 9b) and between 2000 and 1996 (Figure 9c) was computed similarly (negative values indicate increased backscatter intensity in the later year). |
|||
|
|

Download Adobe Acrobat Reader at http://www.adobe.com/support/downloads/main.html.
[an error occurred while processing this directive]

