OF 02-152 Home
DVD-ROM
Contents
Geologic
Discussion
GIS Data
Contacts
|
Field Work
Click on each figure below to view larger image. Click on figure number to go to figure-caption page for links to images in PDF format and for further explanation of the images.
This report presents mapping results
based on the interpretation of data collected in the area shown
on Figure 1. This area was surveyed in
May 1995 and May 1996 using the R/V SEAWARD EXPLORER and in December
1995 using the R/V ARGO MAINE. Approximately 6,000 km of geophysical
data were acquired using a 100-105 kHz swept frequency (CHIRP) sidescan-sonar
system, a 2-7 kHz swept FM (CHIRP) subbottom profiler, a 500-2000
Hz Geopulse boomer subbottom profiler, a two-channel 15 cubic inch
water-gun seismic-reflection system, a 3.5 kHz subbottom and a 200
kHz fathometer; for
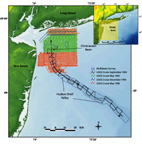 |
| Figure 1. Map showing location of area, ship tracklines and major physiographic and geographic features. |
further information on these systems, see World Wide Web URL woodshole.er.usgs.gov/operations/
sfmapping/.
The water-gun data were acquired at
a 5-s fire interval, 512 ms sweep, and 0.48 ms sample interval. The
CHIRP subbottom data were acquired at a 125-ms fire interval, 125-ms
sweep, and 0.122 ms sample interval. In 1995 during the R/V ARGO MAINE
cruise, the Geopulse data were collected in analog form only. No Geopulse
data were collected during the R/V SEAWARD EXPLORER cruise in 1995
due to equipment failure. The Geopulse data collected in 1996 were
acquired digitally at a 0.5-s fire, 500-ms sweep, and a 0.062-ms sample
interval (due to system failure, no Geopulse data were collected south
of about 40°31'N). Ship tracklines spaced at roughly 325 m were
selected to provide continuous sidescan-sonar coverage of the sea
floor. Ground-truth data for interpretation of the acoustic facies
identified on the sidescan-sonar imagery were provided by a suite
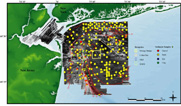
of Van Veen sediment grab samples (Schwab and others, 2000a) (Fig.
2a).
|
|
Figure 2a. Map showing sidescan-sonar imagery of the study area with overlays showing sediment sample locations, bathymetry, and dumpsite locations. Also links to larger image. |
Multibeam swath-bathymetry data were
collected on cruises of the R/V CREED in November 1996 and October
1997 (Butman and others, 1998). Areas selected for this surveying
were mapped (Fig. 1) using a hull-mounted
Simrad EM-1000 system operating at 95 kHz. The EM-1000 data were
logged digitally in Simrad telegram format, which includes navigation,
sensor attitude, water depth, and backscatter. All data were internally
corrected for ship heave, roll, pitch, and water-column velocity.
Absolute vertical accuracy of the EM-1000 bathymetric data is about
1% of the water depth for the inner +60° sector and about 2-3%
for the outermost beams (Hughes Clarke and others, 1996).
Sidescan-sonar and subbottom data
collected during a cruise of the R/V ATLANTIC SURVEYOR in September
1994 extend from the Hudson Shelf Valley south of latitude 40°
10' (Fig. 1). These data were obtained
for a USGS study of the dispersal of contaminated dumpsite sediments
in the New York Bight region (Buchholtz ten Brink and others, 1994).
Approximately 325 km of geophysical data were collected using a
100-105 kHz swept-frequency (CHIRP) sidescan-sonar system operating
at a 100-m swath width, and a 2-7 kHz swept FM (CHIRP) subbottom
profiler (Fig. 1).
Ship navigation for all cruises was
conducted using a Differential Global Positioning System (DGPS).
The sidescan-sonar towfish, which includes a CHIRP subbottom profiler,
was navigated using an acoustic ranging system. The position of
the towfish was calculated assuming that the towfish was directly
behind the research vessel; i.e., that it followed the ship trackline.
This assumption is relatively accurate when the research vessel
is running in a straight line, and only a small amount of tow cable
is deployed. Using these navigation data, position of bathymetric
and seismic-reflection data are accurate to within ±3 m.
To view files in PDF format, download free copy of Adobe Acrobat Reader www.adobe.com/products/acrobat/alternate.html.
|