OF 02-152 Home
DVD-ROM
Contents
Geologic
Discussion
GIS Data
Contacts
|
Mapping Results
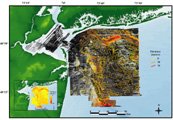
Click on each figure below to view larger image. Click on figure number to go to figure-caption page for links to images in PDF format and for further explanation of the images.
Seismic-stratigraphic and seismic-facies
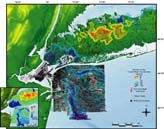 |
| Figure 6. Map showing elevation of the Coastal Plain Unconformity. Also link to larger image. |
interpretations were conducted using the methods presented in Mitchum
and others (1977). Conversion of two-way travel time to subbottom
depth was accomplished by assuming a water velocity of 1500 m sec-1
and a sediment velocity of 1645 m sec-1 in order to be
consistent with the earlier work of Williams (1976). In general,
due to the absence of core material, age relations and environmental
conditions, which resulted in acoustically distinct lithofacies
or internal reflectors, are interpreted
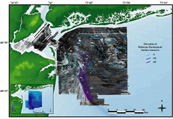 |
| Figure 7. Map showing elevation of Holocene ravinement surface. Also link to larger image. |
from the geometry, lateral extent, and vertical position of the
seismic facies.
Two internal reflectors were identified
as major seismic-stratigraphic horizons in the subbottom data and
can be identified over several adjacent tracklines. Both reflectors
are interpreted to be regional unconformities
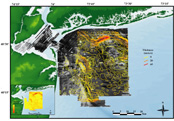 |
| Figure 8. Isopach map showing thickness of Pleistocene sedimentary deposit. Also link to larger image. |
(Foster and others, 1999; Schwab and others, 2000a; Lotto, 2000).
The deeper of these two unconformities separates Upper Cretaceous
to lower Tertiary coastal-plain strata from the overlying Quaternary
sedimentary deposit (see discussion below) and is informally
designated as the coastal-plain unconformity. The second unconformity
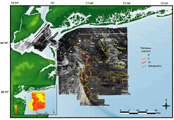 |
| Figure 9. Isopach map showing thickness of the Holocene sedimentary deposit. Also link to larger image. |
separates the Pleistocene sedimentary deposit from overlying Holocene
sediments (see discussion below) and is informally designated as the
holocene ravinement surface. These two horizons were mapped
(Figures 6 and 7).
Stratal thicknesses between these internal reflectors, these unconformities
are displayed as sediment isopach maps (Figures
8, 9, and 10).
The 5- m contour interval on all maps in this
 |
| Figure 10. Isopach map showing thickness of Quaternary (Pleistocene and Holocene) sedimentary deposit.
|
report was chosen based on the resolution of the primary seismic system
used to identify the given seismic-stratigraphic internal reflectors,
data quality, and data coverage.
To view files in PDF format, download free copy of Adobe Acrobat Reader www.adobe.com/products/acrobat/alternate.html.
|