| |  |  | | Lake Pontchartrain Atlas: | | | | | | | | | | | | | | | | | | | | | | | | | | | | | | | Environmental Issues |  | | | | | | | | | | | | | |  | | | | | | | | | | |  | Environmental Issues - Sediment Quality and Dispersal Contributor: Manheim, Hayes, Waters, Flocks 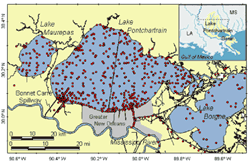 | | Figure 94: Sediment sample sites for chemical and grain size data. Click on the image for a larger version. | Numerous studies over the past three decades have collected surficial sediment samples to determine chemical composition of the Lake bottom (Figure 94). As a part of this project, the studies have been compiled into a comprehensive database (Manheim and Hayes, 2000). A toxic constituent in these sediments is trace metals associated with the input of pollutants to the Lake. Distribution of these metals indicate increased concentrations along the south shore and in the outfall canals (Figure 95 a, b, and c). Average concentrations of trace metals, however, fall below widely-used bulk-sediment toxicity criteria (SQG's) as noted in Table 26. In 1996 and 1997 surficial sediments were sampled over a 3/4 kilometer grid across the Lake. The frequency distribution of various metals measured within these sediments (Figure 96 a, b, and c) indicate an increase in constituents such as Fe and Cu within the surficial sediments, whereas Pb remained relatively static. The increase in trace metals over this time period is attributed by Waters et al., 2000 to diversion of Mississippi River floodwater into the Lake. | Table 26: Average Trace Metal Concentrations | | Lake Pontchartrain1 | Miss. River TSS2 | Toxicity criteria levels | | Constituent | Mean | SD3 | N4 | Mean | N4 | Low5 | Medium6 | | Ag (µ/g) | 0.148 | 0.085 | 127 | | | 1 | 3.7 | | Al (%) | 5.05 | 1.82 | 127 | 8.00 | 73 | NA | NA | | As (µ/g) | 7.02 | 3.93 | 127 | | | 8.2 | 7.0 | | Ba (µ/g) | 482.1 | 187.6 | 115 | | | NA | NA | | Cd (µ/g) | 0.211 | 0.162 | 127 | 1.3 | 7.3 | 1.2 | 9.6 | | Co (µ/g) | 9.41 | 2.43 | 121 | 21 | 73 | NA | NA | | Cr (µ/g) | 26.3 | 19.8 | 285 | 80 | 73 | 81 | 370 | | Cu (µ/g) | 17.5 | 8.99 | 285 | 45 | 73 | 34 | 270 | | Fe (%) | 2.43 | 1.07 | 248 | 4.61 | 73 | NA | NA | | Hg (µ/g) | 0.42 | 0.021 | 114 | | | 0.15 | 0.71 | | Mn (µ/g) | 526.2 | 398.7 | 127 | 1300 | 73 | NA | NA | | Ni (µ/g) | 18.2 | 7.86 | 248 | 55 | 73 | 20.9 | 51.8 | | Pb (µ/g) | 17.5 | 6.78 | 164 | 46 | 73 | 46.7 | 218 | | Sb (µ/g) | 0.62 | 0.36 | 127 | | | | | | Se (µ/g) | 0.34 | 0.22 | 122 | | | | | | Sn (µ/g) | 1.53 | 0.76 | 126 | | | | | | V (µ/g) | 78.3 | 31.3 | 121 | | | | | | Zn (µ/g) | 73.3 | 31.1 | 285 | 193 | 73 | 150 | 410 | NA = these elements are not toxic even at high concentrations.
1 Mean chemical composition of Lake Pontchartrain sediments (from comprehensive database).
2 Data for Mississippi River total suspended solids (TSS) from Presley et al., 1980.
3 Standard deviation.
4 Number of samples.
5 Sediment quality guidelines (SQG) for potential toxicity levels ("Low"), Long et al., 1995.
6 Sediment quality guidelines (SQG) for potential toxicity levels ("Medium"), Long et al., 1995.
| | Table 26: Average trace metal concentrations for Lake Pontchartrain and Mississippi River. | 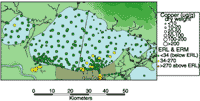 | 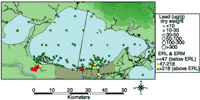 | | Figure 95: a) (top left) Copper concentrations in sediments from Lake Pontchartrain and Maurepas. b) (top right) Lead concentrations in sediments from Lake Pontchartrain. c) (bottom left) Zinc concentrations in sediments from Lakes Pontchartrain and Maurepas. Click on the maps for a larger version. | 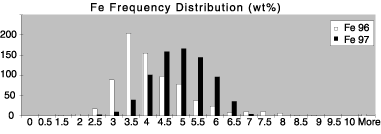 | 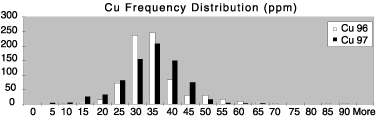 | 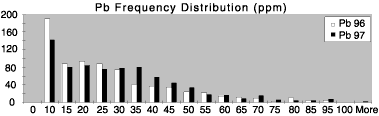 | | Figure 96: a) (top) Frequency distribution of Iron (weight %) within sediment fine fraction preceding and following spillway event. b) (middle) Frequency distribution of Copper (weight %) within sediment fine fraction preceding and following spillway event. c) (bottom) Frequency distribution of Lead (weight %) within sediment fine fraction preceding and following spillway event. | « Previous | Next » |