Maintenance Procedures for the McLane WTS-P Instrument
The basic operation, software applications, and maintenance protocols of the WTS-P are similar to those of the WTS-Tr unit. The menu driven software allows the user to choose a menu item and enter a range of parameters for initiating the pump routines.
Similar to the WTS-Tr during a pumping event, the WTS-P software is designed to decrease the flow rate when the backpressure on a filter (due to sample loading) is increased. The internal computer records and logs the flow rate, the total volume for each sampling event and the external standard deviation of pressure (PSDEV) at the time that pumping commences. Along with the electronics package having been simplified, the software for the WTS-P has been upgraded to allow the user more flexibility during programming operations.
The instrument has also been modified to monitor storm events by the use of an external pressure transducer. These pressure standard deviation (PSDEV) values are a function of ocean surface wave heights and are collected and averaged over a pre-determined length of time (defined by the user) by an algorithm in the software. PSDEV values have been found to correlate directly with the intensity of bottom resuspension. As the time averaged PSDEV value exceeds a pre-determined threshold a "storm sequence" is initiated and up to five samples over the duration of the storm may be taken. If the PSDEV threshold is not exceeded, samples are taken according to a user-defined time schedule based on the length of the deployment.
Maintenance of the Controller Housing and Electronics Package
Maintenance procedures for the controller housing and electronics package are virtually identical to those of the WTS-Tr instrument as described in an earlier section of this report.
Access and removal of the end cap and attached electronics package and battery housing from the controller case is similar to that of the WTS-Tr. The electronics package is more compact than the comparable electronic board configuration of the WTS-Tr.
Unlike the WTS-Tr instrument, the power supply package of the WTS-P contains individual C-cell alkaline batteries enclosed within a high-impact plastic holder. Prior to each deployment, new batteries that have been tested under a load should be installed.
There is a nine-volt battery located at the top of the electronics package that should be replaced with a new load tested battery. Re-installation of the electronics package is performed in a similar manner to that of the WTS-Tr unit.
Maintenance of the WTS-P Pump Assembly
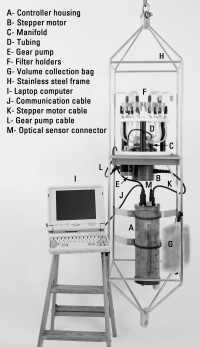
The configuration and operation of the pump assembly's of the WTS-TR and WTS-P instruments differ somewhat as shown in Figure 1A and Figure 1B, respectively.
The pump assembly of the WTS-P is comprised of: the integrated pump head (which contains the filter holders and associated tubing), pump motor, and multi-port valve. The maintenance procedures for these features are virtually identical to those described for the WTS-Tr in an earlier section of this paper.
On the pump head, each of the twenty-three filter holders on the WTS-P instrument are connected into their respectively numbered quick disconnect fittings. The positive displacement pump motor draws water through a single intake port of the dual multi-port valve, which directs the water sample into, and through the appropriate sequenced filter holder. Unlike the WTS-Tr instrument (where after a pump event the valve sequences to the next available port), the valve of the WTS-P returns to the homeport after each sampling event.
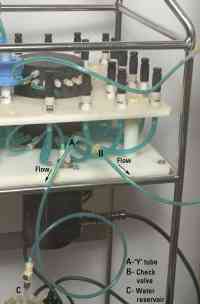
A unique feature of this instrument is that the user may program the system to flush a prescribed volume of pre-filtered water through the tubes, valve, and out through the intake port before and after each sample is collected. This is accomplished from a 500 ml reservoir of filtered water. This reservoir is positioned onto one side of a “Y” tube fitting connected to the exit port of the gear pump motor (Figure 1B and Figure 10). A small (25 mm diameter) one way check valve is located on the other side of the “Y” fitting. As a pumping event is initiated, filtered seawater is pumped into and fills the reservoir. As pumping continues, the increased water pressure within the system opens the one-way check valve and allows the excess filtered water to flow into the environment.
Applying water pressure from a syringe to either side of the valve and observing the results of the flow patterns may also test the check valve. The “Y” tubing assembly, one-way check valve, and the reservoir bag should be checked and cleaned before each deployment.
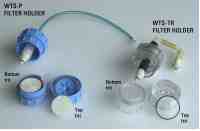
The general inspection and replacement of all the 1/8" tubing and quick disconnect fittings associated with the filter holders should be completed prior to any testing and subsequent field deployment. Tubing on the down-stream side of the filter holders should also be examined and replaced if brittle or discolored. The 47 mm filter holders and internal parts should be cleaned according to laboratory criteria and reassembled (without the top internal frits- Figure 5). These are stored in a clean environment with the enclosed pre-weighed polycarbonate filters (47mm diameter, 0.4 micron opening).
The filter holders are labeled and sequentially mounted onto the pump head prior to field deployment. The pump motor is the identical type of 3-phase brushless DC motor used on the WTS-TR unit and should be serviced in a similar manner.
WTS-P Laboratory Testing Procedures
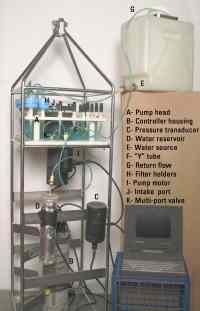
The laboratory arrangement and procedures for testing the WTS-P are different than those described for the WTS-Tr instrument.
The setup of the instrument in the laboratory (Figure 1B) includes: the pump head with all 23 filter holders connected to the multi-port valve head (the filter holders contain no top frits or filters), data logger, external pressure sensor, the external water filled reservoir for flushing the system, and a water source.
The water source is a bottom withdrawal carboy (10 to 20 liter capacity) filled with distilled water. A length of tubing is connected from the bottom withdrawal spigot of the carboy to the main intake port on the pump head. A few reducing fittings may be necessary to adapt progressively smaller tubing diameters from the carboy spigot to the 1/8 in tubing and twist lock fitting required on the intake port of the pump head.
Connected to the exit port of the gear pump is a “Y” tube (figure 10). One arm of the “Y” is connected to a 500 ml water reservoir (filled with distilled water).
The other arm of the “Y” contains bypass tubing with an in-line one-way check valve and an additional length of tubing connected to the downstream end of the check valve. The end of this tubing extends to the top of the carboy and down into the distilled water and rests near the bottom. As each scheduled pump event occurs, the system is flushed with a pre-programmed volume of distilled water from the reservoir. As the pumping event continues, the water pressure increases as the flush bag is filled; the check valve opens and allows the overflow to exit back to the carboy. In this case the overflow water is pumped directly back into the carboy creating a "closed loop" type of system. After the pumping event is completed, the system is again flushed with a pre-determined volume of filtered water from the reservoir.
The design of this test system allows the user to monitor much of the software and hardware operations during a fully programmed deployment sequence in a controlled laboratory environment.
- After creating an appropriate file from the crosscut or ProComm emulator program to capture the user inputs and pumping data to a file, a unique deployment schedule is run to evaluate some of the functional mechanical and software aspects of the instrument (Appendix 4).
- Upon accessing the main menu of the instrument, ensure the output values are accurate via the diagnostics menu number 2. The pressure transducer readings should read approximately at atmospheric pressure (between 14.5 and 15 psi) on the display screen. If these values are markedly different, make sure the constants for the transducer (C, T, and D) are correctly input in menu number seven. Make sure the port on the bottom of the sensor is free of debris. The transducer may need to be re-calibrated if the problem persists.
- Next select menu 5- deploy system. The left justified text prompts the user to respond with a range of suggested parameters. Aside from the unique user defined time and dates for deployment and recovery, the suggested remaining inputs are for initiating pump events based on time-series sampling only with no storm events induced from pressure transducer data (Appendix 4).
The user may remain in the monitor mode to observe the following: sequencing of the valve during the initiation of the pump cycle, flushing of a pre-determined volume of water through the system, the pumping event of a prescribed volume, and the flushing sequence after the pump event. The user may exit the monitor mode and remove the communication cable if so desired.
- When the deployment time has elapsed and the test is completed: access the instrument, create a capture file, and download the data from menu option number six (offload data to a disc). A summation of the pumping events, detailed records of the pump volumes, and PSDEV data will result. A summary of pump events data from the E-prom cache backup file (menu item nine) may also be accessed and downloaded at this juncture.
From the downloaded data the user will notice that the timing and number of the pump events may differ from those of the original deployment schedule. The software will recalculate the schedule because, in this case, no storm is found within a prescribed amount of time.
As an example, the verification schedule from Appendix 4 displays 22 scheduled events based on the deployment and recovery dates and number of storms and samples (1 each) as entered by the user. However, after the instrument has completed its deployment schedule and as no storm was found, the data contain 23 scheduled events with the recalculated times, appropriate volumes and PSDEV data.
Additional tests were performed to evaluate the sampling efficiency of the WTS-P instrument using unique sediment types at known concentrations under controlled laboratory conditions. The results of these tests are shown on Table 4 and Appendix 6.
WTS-P Field-Testing Procedures
Prior to each long-term field deployment in Massachusetts Bay, a test of the WTS-P instrument is conducted off the WHOI dock facility. The logistics are similar to that as previously described under "Field Testing" for the WTS-Tr instrument.
The test evaluates the remaining WTS-P software as the instrument responds to a number of simulated storm events created by time averaged pressure values (PSDEV) in response to raising and lowering the instrument through the water column. Similarly, a Niskin bottle is lowered to the same depth as the WTS-P system and collects a simultaneous water sample during each pump event. The pump assembly and controller housing are mounted in a test frame and is shown on Figure 1B.
The procedure for the dock test deployment is as follows:
- The function of measuring and reporting the volume filtered by the WTS-P instrument is tested at the dock using the same procedure described for the WTS-Tr unit. It involves use of a blood bag to collect the water filtered at depth, measuring the volume of the contents of the bag at the surface using a graduated cylinder, and comparing the volume with the software calculations made by the WTS-P instrument. At least two samples (filters) are recommended for this test. The comparison of volume measurements should be within 8 percent.
- Ten filter holders containing pre-weighed filters are connected to sequential ports on the pump assembly head. One filter holder is used to collect a sample at the initial scheduled time event prior to any storm-induced events. Five filter holders are used for sampling in response to the induced storm events. Three filter holders are used for calibration purposes with one reserved as a spare. The pressure transducer is mounted onto the frame and connected to the appropriate bulkhead connector on the controller housing.
- After the appropriate capture file is created, a short deployment schedule is initiated using data inputs shown in Appendix 5.
Raising and lowering the frame through the water column several times for a distance of several meters during pre-determined time intervals simulates a pressure change indicating a storm event. The software calculates the change in standard deviation of the pressure. These changes are averaged over time. If they exceed a pre-determined threshold value the software initiates a series of sampling events during this user defined storm cycle.
- Progress of these events may be monitored on a personal computer with the use of a communication cable attached to the communications port of the controller housing. The volume of water pumped through the system is not collected in an external bag as with the WTS-Tr because the system must remain in the water for this phase of the testing.
- Upon completion of the test, the filters are processed and the weight of suspended matter calculated. These results are then compared with the Niskin samples collected during each storm sampling sequence. The data is downloaded to a disc for further review.
Results of the suspended matter concentrations collected by the WTS-P instrument and the Niskin bottle are shown on Table 3 and Appendix 6.
Field Deployment and Recovery of the WTS-P Instrument
The pump assembly, controller housing, pressure transducer and flush bottle are mounted within the framework of an ocean bottom tripod similar to that of the WTS-Tr instrument. Prior to this operation, the filter holders are mounted into their respectively numbered ports on the pump head and the whole system primed with filtered distilled water. This is accomplished by inverting the entire pump assembly and allowing filtered distilled water to flow through from the intake hose of the pump motor backwards through a filter holder and out the intake port of the WTS-P. The valve is then stepped to the next filter holder position and the procedure repeated until all 23 ports and filter holders have been primed. A brine solution (70 ppt) is used in a similar manner to prime the system during cold weather operations if freezing temperatures on deck are expected.
After the filters have been primed, a single length of tubing is connected to the intake port and a single anti-fouling tip affixed to the end of it. The intake port is linked to a stiff stainless steel wire that secures the position of the port about 50 cm away from any object on the tripod.
A file is created and the appropriate deployment parameters entered by the user according to programmatic objectives. An example of the data input for the Massachusetts Bay program deployment schedule is displayed in Appendix 7. Upon recovery, the WTS data is accessed and downloaded according to the menu driven instructions in a similar manner to that outlined for the WTS-Tr instrument.
Protocols for laboratory and field-testing with which to evaluate the overall functional capability of the McLane WTS-Tr and the WTS-P instruments have been presented. The majority of the software and hardware problems usually manifest themselves during these testing procedures and may be rectified prior to a long-term field deployment.
|