
|
Figure 1. Map showing the location of the survey area (outlined in red) offshore of eastern Massachusetts between Duxbury and Hull. The 50-meter depth contour is shown. Black rectangle indicates area of detail shown in figures 2, 4, and 5. |
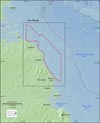 |
Figure 2. Map showing tracklines of geophysical data collected by USGS (red and green lines) and NOAA (purple lines). USGS, U.S. Geological Survey; NOAA, National Oceanic and Atmospheric Administration. |
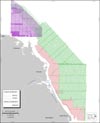 |
Figure 3. Photographs of research vessels used for mapping surveys in this project. A, RV Megan T. Miller; B, RV Rafael; C, RV Connecticut; D, RV Thomas Jefferson. |
 |
Figure 4. Map showing shaded-relief topography of seafloor in study area. Coloring and bathymetric contours represent depths in meters, relative to the Mean Lower Low Water (MLLW) datum. |
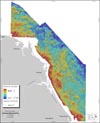 |
Figure 5. Map showing sampling sites over acoustic-backscatter intensity in the study area. Backscatter intensity is an acoustic measure of the hardness and roughness of the seafloor. In general, higher values (light tones) represent rock, boulders, cobbles, gravel, and coarse sand. Lower values (dark tones) generally represent fine sand and muddy sediment. Tonal variations may occur across track in the sidescan-sonar data and between survey days in the multibeam echosounder data. |
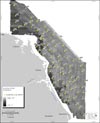 |
Figure 6. Photograph of the SEABed Observation and Sampling System (SEABOSS), which was used to collect photographic data and sediment samples. |
 |
|


