Skip past header information
USGS - science for a changing world

U.S. Geological Survey Open-File Report 2011-1156

Carolinas Coastal Change Processes Project Data Report for Observations near Diamond Shoals, North Carolina, January-May 2009


List of Figures

Skip past contents information
Thumbnail image for Figure 1, Location map for Cape Hatteras, NC. Markers are placed to identify locations of  moorings.

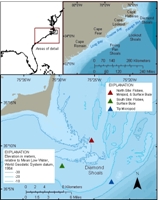
Figure 1. Location map for Cape Hatteras, North Carolina. Markers are placed to identify locations of moorings.

Thumbnail image for Figure 2, photograph of the Flobee tripod located at the north site

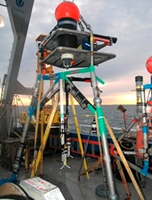
Figure 2. The Flobee tripod located at the north site. Photograph by Sandra Baldwin.

Thumbnail image for Figure 3, a photograph of the North site minipod post recovery. Photo courtesy of Sandy Baldwin.

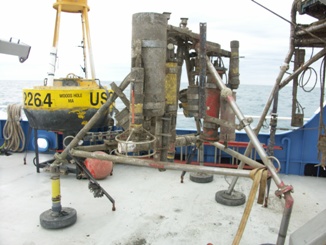
Figure 3. The North site minipod post recovery. Photograph by Sandra Baldwin.

Thumbnail image for Figure 4, A photograph of the North surface buoy. Photo courtesy of Sandy Baldwin.

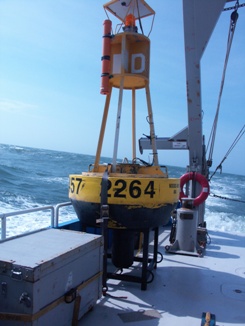
Figure 4. The North surface buoy. Photograph by Sandra Baldwin.

Thumbnail image for Figure 5, A photograph of the Flobee tripod deployed at the South site. Photo courtesy of Sandy Baldwin.

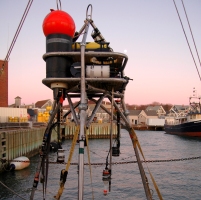
Figure 5. The Flobee tripod deployed at the South site. Photograph by Sandra Baldwin.

Thumbnail image for Figure 6, A photograph of the North and South surface buoys.  Photo courtesy of Sandy Baldwin.

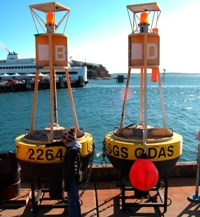
Figure 6. The North and South surface buoys. Photograph by Sandra Baldwin.

Thumbnail image for Figure 7, A photograph of the micropod tripod deployed off the top of Cape Hatteras. Photo courtesy of Sandy Baldwin.

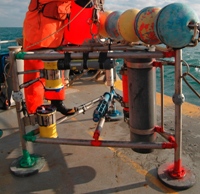
Figure 7. The micropod tripod deployed off the tip of Cape Hatteras. Photograph by Sandra Baldwin.

Thumbnail image for Figure 8, A photograph of USGS employees deploying the grab sampler. Photo courtesy of Sandy Baldwin.

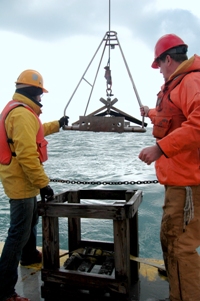
Figure 8. U.S. Geological Survey employees deploying the grab sampler. Photograph by Sandra Baldwin.

Thumbail image for Figure 9, A photograph of a PCADP. Photo courtesy of Brandy Armstrong.

Figure 9. A Sontek Pulse-Coherent Acoustic Doppler Profiler (PCADP).

Thumbail image for Figure 10, A photograph of an RD Instruments Acoustic Doppler Current Profiler (ADCP).

Figure 10. An RD Instruments Acoustic Doppler Current Profiler (ADCP).

Thumbail image for Figure 11,  A photograph of an an Aquatec Acoustic Backscatter Sensor

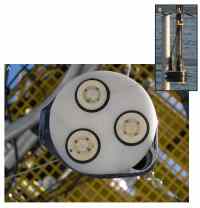
Figure 11. An an Aquatec Acoustic Backscatter Sensor (ABS).

Thumbail image for Figure 12, A photograph of a Sontek Triton Acoustic Doppler Velocimeter

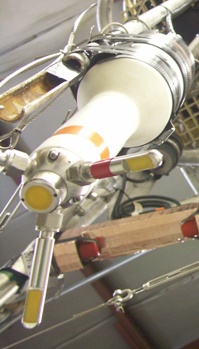
Figure 12. A Sontek Triton Acoustic Doppler Velocimeter (ADV).

Thumbail image for Figure 13, A photograph of an Imagenex Rotating Sonar. Photo courtesy of Sandy Baldwin.

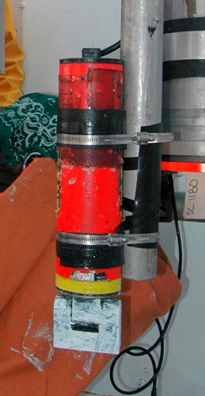
Figure 13. An Imagenex Rotating Sonar system. Photograph by Sandra Baldwin.

Thumbail image for Figure 14, A photograph of a Paroscientific Pressure Sensors

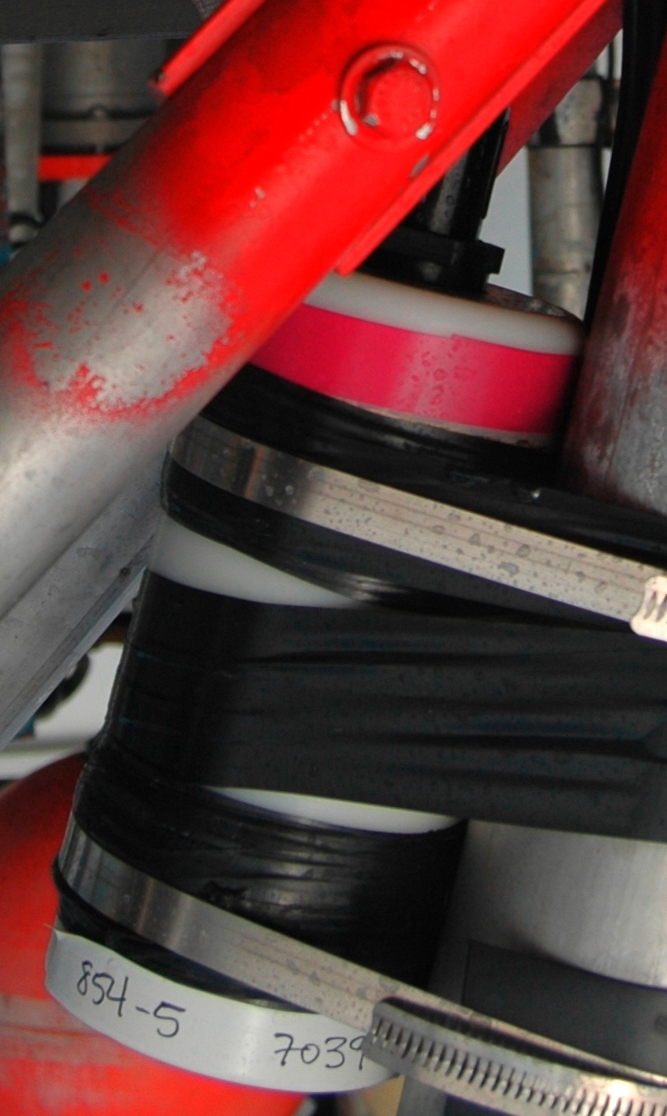
Figure 14. A Paroscientific Pressure Sensor.

Thumbail image for Figure 15, A photograph of a Sea-Bird SEACAT

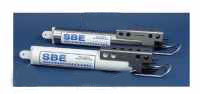
Figure 15. A Sea-Bird SEACAT .

Thumbail image for Figure 16,  A photograph of a Sea-Bird MicroCAT

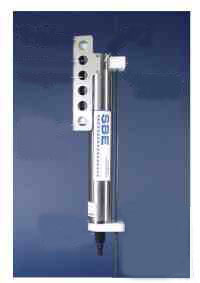
Figure 16. A Sea-Bird MicroCAT.

Thumbail image for Figure 17, A photograph of an Optical Backscatter Sensor

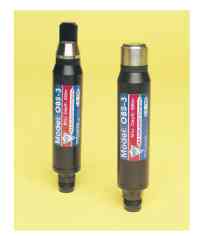
Figure 17. An Optical Backscatter Sensor (OBS).

Thumbail image for Figure 18, OBS with anti-fouling wiper

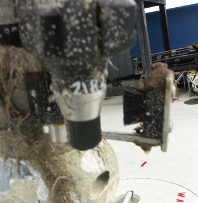
Figure 18. Optical Backscatter Sensor (OBS) with anti-fouling wiper.

Thumbail image for Figure 19, Transmissometer with copper anti-fouling tape

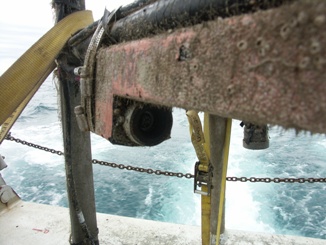
Figure 19. Transmissometer with copper anti-fouling tape.

Thumbail image for Figure 20, ADV bio-fouling

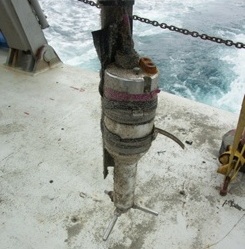
Figure 20. Bio-fouling of an Acoustic Doppler Velocimeter (ADV).

Thumbail image for Figure 21, ADV bio-fouling

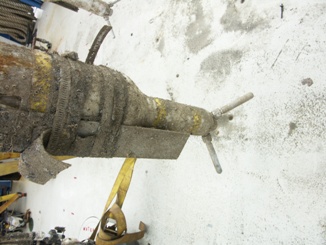
Figure 21. Bio-fouling of an Acoustic Doppler Velocimeter (ADV).

Thumbail image for Figure 22, PCADP bio-fouling

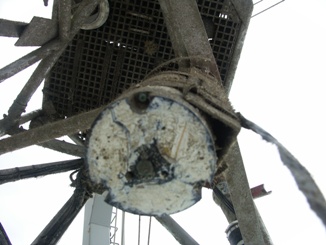
Figure 22. Bio-fouling of a Pulse-Coherent Acoustic Doppler Profiler (PCADP).

Thumbail image for Figure 23, ABSS bio-fouling

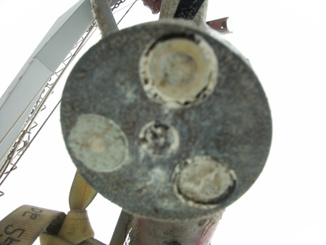
Figure 23. Bio-fouling of an Acoustic Backscatter Sensor (ABS).

Thumbail image for Figure 24, Sonar with anti-fouling zinc paste

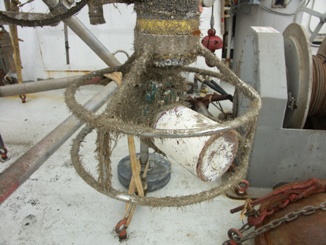
Figure 24. Sonar with anti-fouling zinc paste.

Thumbail image for Figure 25, Fanbeam with anti-fouling zinc paste

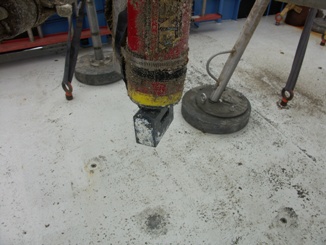
Figure 25. Fanbeam with anti-fouling zinc paste.

Thumbail image for Figure 26, Camera case bio-fouling

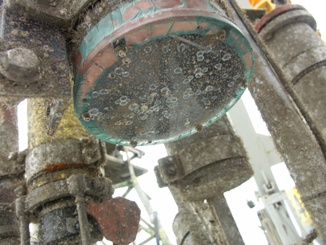
Figure 26. Bio-fouling of a Camera case.

Thumbail image for Figure 27, LISST bio-fouling

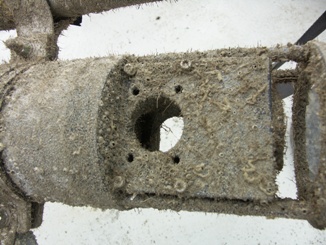
Figure 27. Bio-fouling of a Laser In Situ Suspended Scattering and Transmissometry (LISST).

Thumbail image for Figure 28,  Aquadopp and tripod fouling.

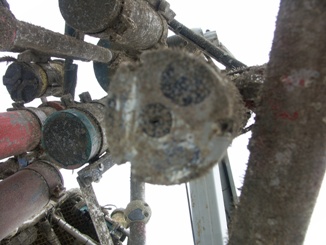
Figure 28. Bio-fouling of an Aquadopp and tripod.

Thumbail image for Figure 29, CTD bio-fouling

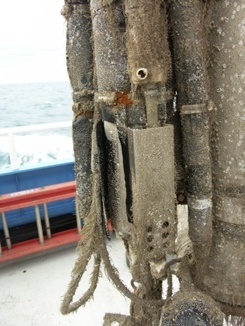
Figure 29. Bio-fouling of a SEACAT and pump.

Thumbail image for Figure 30, Transmissometer bio-fouling

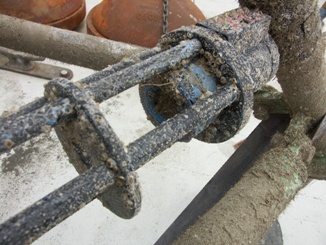
Figure 30. Bio-fouling of a Transmissometer.

Thumbail image for Figure 31, Micro-cat bio-fouling

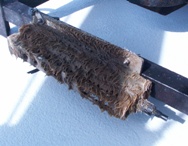
Figure 31. Bio-fouling of a MicroCAT.

Thumbail image for Figure 32, ABSS with anti-fouling zinc paste.

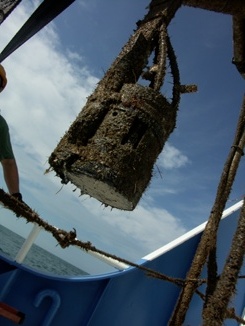
Figure 32. Acoustic Backscatter Sensor (ABS) with anti-fouling zinc paste.

Thumbail image for Figure 33, PCADCP with anti-fouling zinc paste

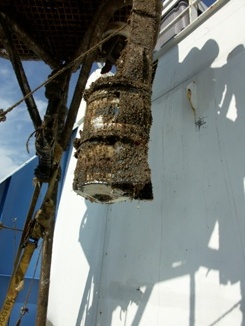
Figure 33. Pulse-Coherent Acoustic Doppler Profiler (PCADCP) with anti-fouling zinc paste.

Thumbail image for Figure 34, ADV bio-fouling

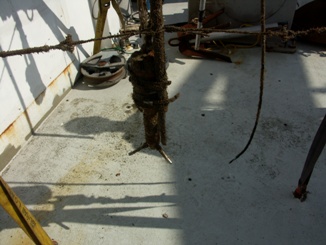
Figure 34. Acoustic Doppler Velocimeter (ADV) bio-fouling.

Thumbail image for Figure 35, Transmissometer with copper anti-fouling tape.

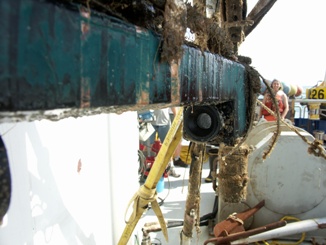
Figure 35. Transmissometer with copper anti-fouling tape.

Thumbail image for Figure 36, ADCP and tripod fouling

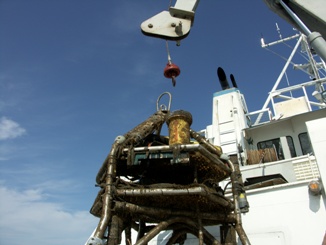
Figure 36. Acoustic Doppler Current Profiler (ADCP) and tripod fouling.

Thumbail image for Figure 37, OBS bio-fouling

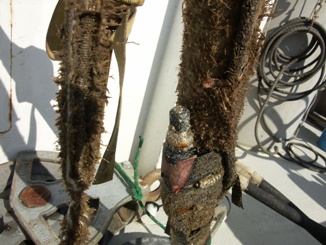
Figure 37. Optical Backscatter Sensor (OBS) bio-fouling.

Thumbail image for Figure 38, OBS bio-fouling

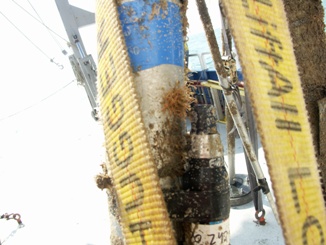
Figure 38. Optical Backscatter Sensor (OBS) bio-fouling.

Thumbail image for Figure 39, CTD and Transmissometer bio-fouling

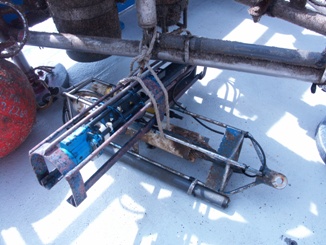
Figure 39. SEACAT and Transmissometer bio-fouling.

Thumbail image for Figure 40, ADCP with anti-fouling zinc paste

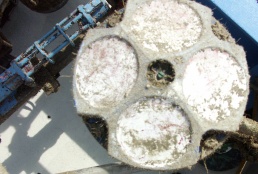
Figure 40. Acoustic Doppler Current Profiler (ADCP) with anti-fouling zinc paste.

Thumbail image for Figure 41, Transmissometer bio-fouling

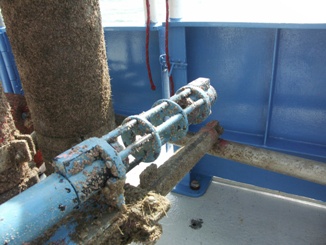
Figure 41. Transmissometer bio-fouling.

Thumbail image for Figure 42, CTD bio-fouling

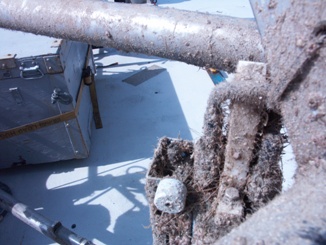
Figure 42. SEACAT bio-fouling.

Figure 43. Locations of supporting observations.

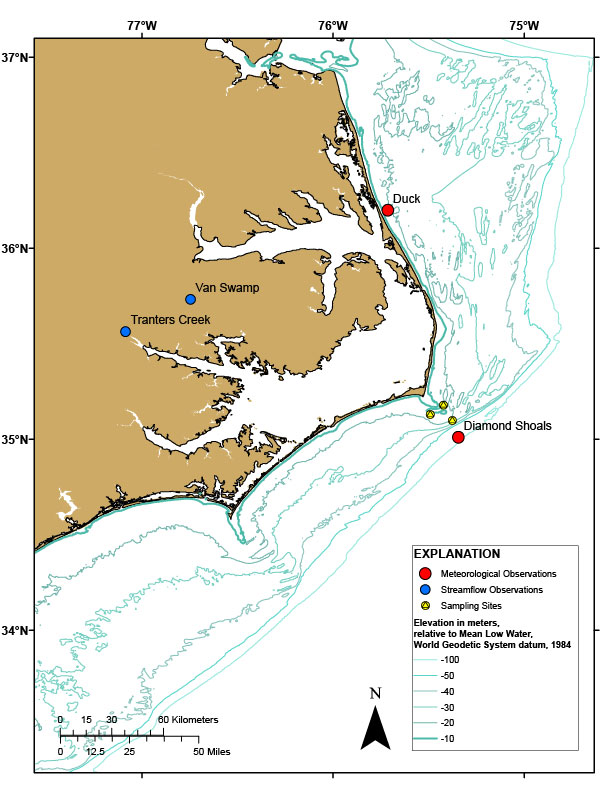
Figure 43. Map showing locations of supporting observations.

Skip USGS links group

Accessibility FOIA Privacy Policies and Notices

Take Pride in America logo USAGov logo U.S. Department of the Interior | U.S. Geological Survey
End of USGS links group