U.S. Geological Survey Open-File Report 2011-1156
Carolinas Coastal Change Processes Project Data Report for Observations near Diamond Shoals, North Carolina, January-May 2009
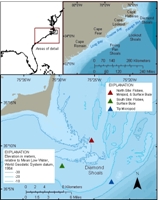
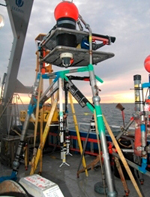
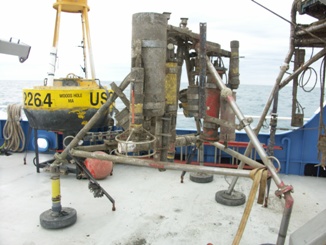
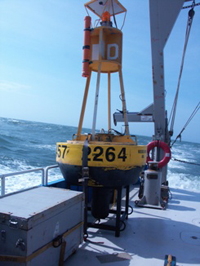
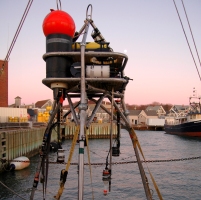
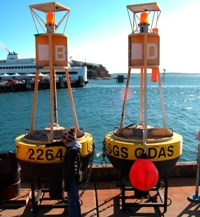
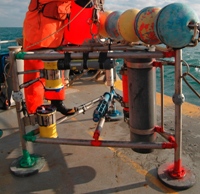
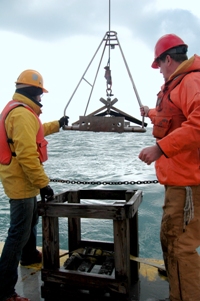
North Site North Flobee The North Flobee was located at 35.17863° N, 75.42292° W and was deployed on the seafloor at a water depth of 14.7 meters. Instruments mounted on this tripod consisted of an Acoustic Doppler Current Profiler (ADCP), Acoustic Doppler Velocimeters (ADVs), Optical Backscatter Sensors (OBSs), an Acoustic Backscatter Sensor System (ABSS), a Pulse-Coherent Acoustic Doppler Profiler (PCADP), Sontek hydra systems, Seatech transmissometers, Paroscientific (Paros) Pressure Sensors, a Sea-Bird SEACAT, and a Sea-Bird MicroCAT (fig. 2). During the deployment the tripod tipped over near mid April. This created substantial tilt of the sensor measurements on the tripod. Velocity and other data that were jeopardized have been removed from the dataset. Data from some instruments, such as pressure and temperature, were retained but may show an offset at that event. This tripod was recovered on May 10, 2009. North Minipod The North Minipod was deployed at 35.1783° N, 75.423355° W, at a water depth of 14.8 meters. Instrumentation consisted of an ADCP, a time-series visual image camera with a flash, a pencil beam and rotating sonar imaging system, a Sea-Bird SEACAT, a Seatech transmissometer, a laser in situ scattering and transmissometer instrument (LISST), and an Aquadopp Acoustic Profiler (fig. 3). This tripod was recovered on May 10, 2009. North Surface Mooring The North surface mooring was deployed at 35.177867° N, 75.422617° W, at the water surface. Instrumentation consisted of ARGOS (Seimac CML) and Iridium (Xeos melo) satellite beacons on the buoys to track position, a Sea-Bird SEACAT, a Sea-Bird MicroCAT, and a pressure and temperature sensor (PT) (fig. 4). This mooring was recovered on May 1, 2009. South Sites South Flobee The South Flobee was deployed at 35.12958° N, 75.49204° W, at a water depth of 14.0 meters. Instrumentation mounted on the tripod consisted of an ADCP, ADVs, OBSs, an ABS system, a PCADP, Sontek hydra systems, Seatech transmissometers, Paros pressure sensors, a Sea-Bird SEACAT, and a Sea-Bird MicroCAT (fig. 5). This tripod was recovered on May 10, 2009. South Surface Mooring The South surface mooring was deployed at 35.12895° N, 75.49187° W, at the water surface. Instrumentation consisted of ARGOS (Seimac CML) and Iridium (Xeos melo) satellite beacons on the buoys to track position, a Sea-Bird SEACAT, and a PT (fig. 6). This tripod was recovered on May 1, 2009. Tip Site Tip Micropod The micropod was deployed at 35.098985° N, 75.376055° W, at a water depth of 23.7 meters. Instruments mounted on this tripod consisted of an upward-looking ADCP, a Sea-Bird SEACAT, and a Seatech transmissometer (fig. 7). A change in the deployment depth at the Tip Micropod site resulted in data that did not reach the surface. This tripod was recovered on May 1, 2009. Sediment Study Surficial grab samples of sediment were obtained at the deployment locations to determine characteristics of the seabed. The samples were analyzed by the USGS Sediment Lab in Woods Hole for grain-size distribution, information that is critical to understanding the formation of the shoal and the regional sediment dynamics (fig. 8). |