U.S. Geological Survey Open-File Report 2011-1156
Carolinas Coastal Change Processes Project Data Report for Observations near Diamond Shoals, North Carolina, January-May 2009
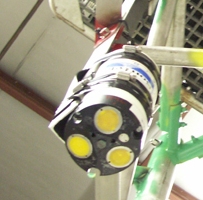
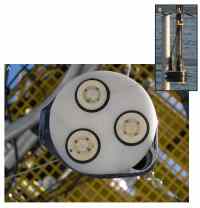
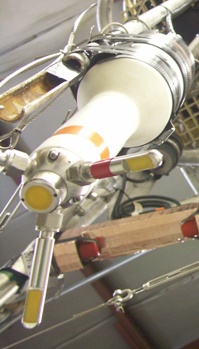
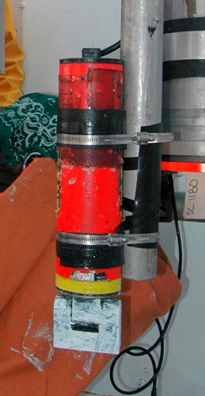
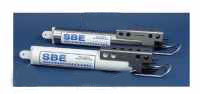
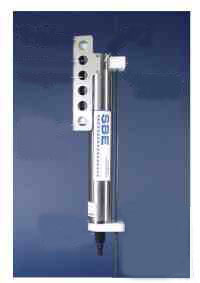
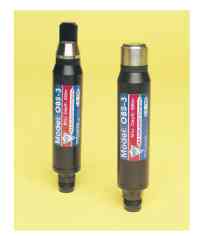
A variety of instruments from many manufacturers was used to measure water flow, sea level, conductivity, temperature, wave characteristics, near-bottom turbulence, sea-floor bed forms, and suspended-sediment concentrations. These instruments were deployed from January 12, 2009, through May 10, 2009, on a variety of platforms, as described on the Field Program section. Data were recorded at times corresponding to sampling schemes specific to each instrument. The details of the sampling strategy for each instrument are provided in the Summary of Sampling Schemes (PDF format), which includes site-specific platform and sampling information. After recovery of all the tripods and moorings, data were downloaded from all instruments. The data were processed using established techniques (see the Data Processing section) to convert data from proprietary format to scientific units for inclusion in this report. Descriptions of the specific instruments used in this study, taken from Montgomery and others (2008), are provided below. A more complete description of equipment and data processing methods are provided in Montgomery, et al., 2008. Jump to SonTek Pulse-Coherent Acoustic Doppler Profiler (PCADP)RD Instruments (RDI)Acoustic Doppler Current Profiler (ADCP) Triton Acoustic Doppler Velocimeter (ADV) Aquatec Acoustic Backscatter Sensor (ABS) Imagenex Rotating Sonar Paroscientific Pressure Sensor (Paros) Sea-Bird SEACAT Sea-Bird MicroCAT D&A Instruments Optical Backscatter Sensor (OBS) Laser In Situ Suspended Scattering and Transmissometry (LISST) Transmissometer SonTek Pulse-Coherent Acoustic Doppler Profiler (PCADP)The SonTek PCADP (http://www.sontek.com/) measures water flow using Doppler principles. The PCADP, like other acoustic water-flow instruments, the PCADP measures the Doppler shift that occurs when acoustic beams reflect from scatterers that are carried by the water (fig. 9). Unlike the single pulse acoustic water-flow instruments described below, however, each PCADP measurement uses a pair of acoustic pulses. Compared to single acoustic pulse instruments, which measure water flow as averages of sections of the beam that are 50 cm (centimeters) long or longer, paired acoustic pulse instruments provide higher spatial resolution by measuring water-flow measurement regions as short as 1.6 cm along the beam. Processed PCADP water-flow data are included in this report. RD Instruments (RDI) Acoustic Doppler Current Profiler (ADCP)The RDI ADCP (http://www.rdinstruments.com/) also measures the speed and direction of water flow using Doppler principles. Acoustic pulses are transmitted by the transducer assembly along two pairs of orthogonal beams (four beams total) (fig. 10). Scatterers in the water column, such as small particles and plankton traveling with the water flow, reflect the acoustic pulses. The transducer assembly receives the reflected pulses and, using the Doppler effect and basic trigonometry, converts the pulses into eastward, northward, and vertical components of water flow. When installed with waves acquisition firmware, the instruments record three types of time-series from which wave properties may be computed: pressure, range to surface along each orthogonal beam (that is, water level), and orbital velocities of the surface waves taken from three bins nearest the surface in each of the four beams. It is possible to estimate non-directional wave energy spectra and therefore, wave height and period from any of the three time-series, but the orbital velocity time-series are required for definition of the directional distribution of the wave energy. References that describe the principles of operation for the Doppler water-flow measurement technique can be found at http://www.rdinstruments.com/rdi_library.html. The RD Instruments primer on ADCP wave measurements can be found at http://www.rdinstruments.com/waves.html. RDI ADCPs (600-KHz (kilohertz)Workhorse or 1200-KHz Workhorse) were deployed on the North Flobee, South Flobee and Tip Micropod. This report includes processed ADCP water-flow and wave-measurement data. Aquatec Acoustic Backscatter Sensor (ABS)The Aquatec ABS (http://www.aquatecgroup.com/) also measures turbidity in the water column. The ABS sensors emit pulses of high-frequency sound from up to four transducers (fig. 11), which may operate at different frequencies. These pulses are scattered by suspended sediments in the water column. The quantity of sound scattered back to the sensor (backscatter) can be combined with instrument calibration coefficients to determine vertical profiles of suspended-sediment concentrations. An Aquatec ABS was deployed at the North Site on the minipod. This report includes ABS backscatter data. Sontek Triton Acoustic Doppler Velocimeter (ADV)The SonTek/YSI Triton-ADV (http://www.sontek.com) is a single-point, Doppler current meter designed specifically for low-power measurements in shallow water. The Triton-ADV system measures directional wave, tide, and currents, combining the power of SonTek's ADV technology with the proven PUV wave method. The Triton-ADV system was deployed on the North Flobee and the South Flobee (fig. 12). Imagenex Rotating SonarThe Imagenex Rotating Sonar system (http://www.imagenex.com/) produces images of sea-floor bedforms. The sonar emits a beam of high-frequency sound over the sea floor by either rotating or moving in a straight line depending on the model. The sound reflects off objects and bedforms on the sea floor. The length of time required for the reflected sound to return to the sensor is used to generate an image of sea-floor bedforms (fig. 13). An Imagenex Rotating Sonar system was deployed at the North site on the minipod. Paroscientific (Paros) Digiquartz® Pressure SensorsThe Paros Digiquartz® Pressure sensor (http://www.paroscientific.com/) (fig. 14) measures pressure using a quartz-crystal resonator. The frequency of oscillation of this resonator varies with pressure-induced stress. The output pressure is compensated for temperature by using the signal from temperature-sensitive crystals, which are a component of the instrument. Refer to http://www.paroscientific.com/pdf/dqadvantage.pdf for additional information on Digiquartz® technology. Paros Digiquartz® pressure sensors were deployed on the Flobee tripods at the North and South sites (fig. 1). The sampling interval was matched to that of the ADVs (above). Processed Paros pressure data are included in this report. Sea-Bird Electronics (SBE) SEACATThe Sea-Bird SEACAT (http://www.seabird.com/) measures conductivity and temperature. Salinity can be calculated from these measurements (fig. 15). The instruments were equipped with pumps to flush the sensor ducts and reduce salinity spiking. Auxiliary external sensors, such as those for dissolved oxygen, pH, or turbidity, may be attached to the instrument. Data are recorded internally on FLASH RAM memory. Sea-Bird SEACATs were deployed at the North site, the South site, and the Tip (fig. 1). The instruments were deployed on all tripod frames and the surface moorings. SBE39 high-accuracy temperature and pressure recorders were deployed with the surface-mooring SEACATs. Processed SEACAT conductivity, temperature, and salinity data are included in this report. Sea-Bird MicroCATThe Sea-Bird MicroCAT (http://www.seabird.com/) is a lower cost, simpler version of the SEACAT. The MicroCAT uses the same sensor technology (fig. 16) as the SEACAT to collect salinity and temperature data, but cannot record data from auxiliary external sensors. MicroCATs are also smaller, which enables their deployment on U.S. Geological Survey surface buoys (fig. 16). Sea-Bird MicroCATs were deployed on the North Surface buoy, the North Flobee, and South Flobee tripods (fig. 1). This report includes processed MicroCAT conductivity, temperature, and salinity data. D&A Instruments Optical Backscatter Sensor (OBS)The D&A Instruments OBS (http://www.d-a-instruments.com/) measures turbidity in the water column. The sensor (fig. 17) emits a beam of infrared light that is scattered by suspended sediments. Suspended sediment concentration can be derived by combining the quantity of light reflected back to the sensor (backscatter) with instrument calibration coefficients. OBSs were deployed on the North Flobee and South Flobee tripods (fig. 1). The sampling intervals used for the OBSs match those of the ADVs deployed. This report includes OBS backscatter data. Laser In Situ Suspended Scattering and Transmissometry (LISST)The LISST, manufactured by Sequoia Scientific, Inc. (http://www.sequoiasci.com), uses laser diffraction to obtain particle-size distributions of the sediment suspended in the sensing volume. This sensor provides the diameter of particles as opposed to their density. Collimated light is passed through a volume of water, where the suspended particles diffract the beams, and several ring-type detectors at the receiver are used to isolate subranges of angles scattered. A LISST was deployed on the Minipod at the North Site (fig. 1). TransmissometerA transmissometer measures the percentage of light transmitted along a fixed path. U.S. Geological Survey data have typically been collected with Sea Technology and Wetlabs C-Star (http://www.wetlabs.com/products/transmissometers/transmissometers.htm) transmissometers in 5- and 25-cm path lengths. These sensors use light from a red Light Emitting Diode (LED) (650-nm (nanometer)wavelength). The signals commonly decay with time as the optical windows become fouled. When the fouling during a deployment is extreme, transmissometer data may be truncated as part of the processing. In other cases, the data remain, as fluctuations may be observed despite the decreased signal. Transmissometers were deployed at all sites (fig. 1). |