Skip past header information
USGS - science for a changing world

U.S. Geological Survey Open-File Report 2012-1099

Summary of Oceanographic and Water-Quality Measurements near the Blackwater National Wildlife Refuge, Maryland, 2011


Skip past contents information/ Title Page / List of Figures / Conversion Factors / Abstract / Introduction / Instruments / Site Description / Mooring Log / Results / Acknowledgments / References Cited / Appendix


Figure 14.  Fall 2011 data from Blackwater River sites (915, 917).


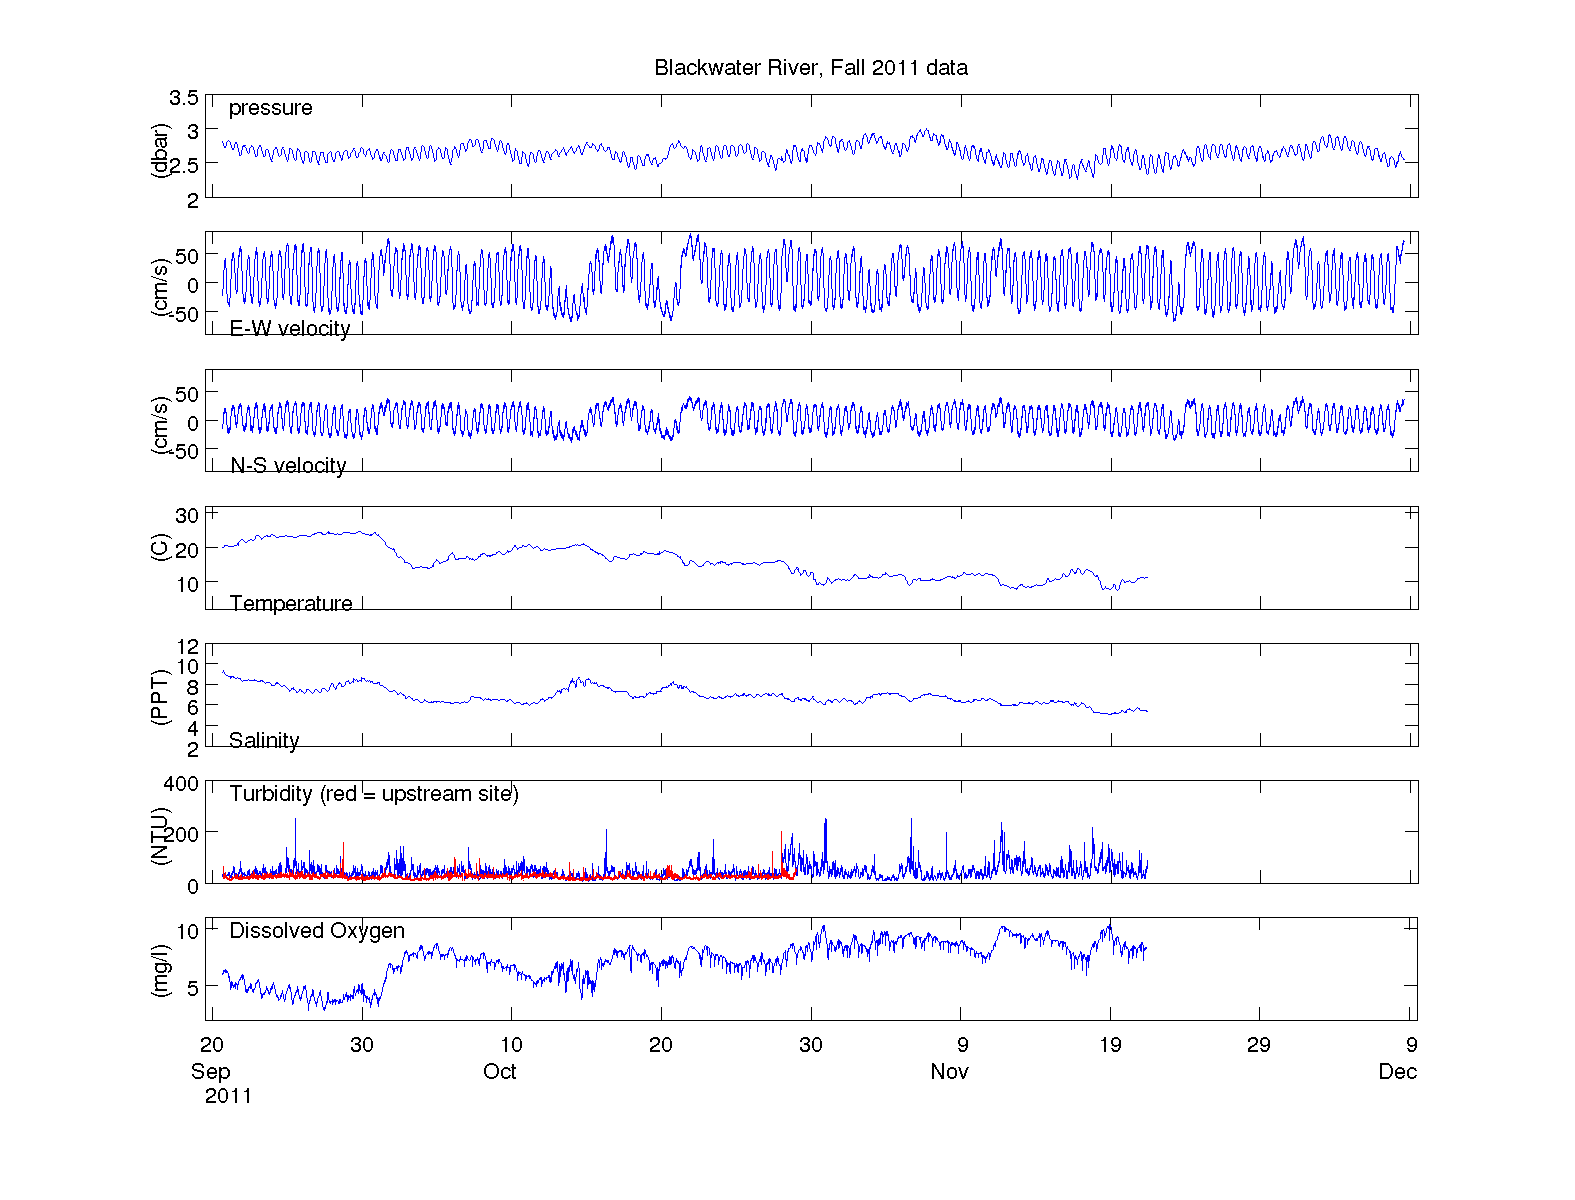
Figure 14. Time series of pressure, east velocity, north velocity, water temperature, salinity, turbidity and dissolved oxygen from Blackwater River sites (moorings 915,917). The turbidity data from the ECO BB from upstream is overlaid in red on the turbidity data from the YSI sonde.

Download the full size image in PDF format.


To view files in PDF format, download a free copy of Adobe Reader.


Skip USGS links group

Accessibility FOIA Privacy Policies and Notices

Take Pride in America logo USAGov logo U.S. Department of the Interior | U.S. Geological Survey
End of USGS links group