U.S. Geological Survey Open-File Report 2012-1099
Summary of Oceanographic and Water-Quality Measurements near the Blackwater National Wildlife Refuge, Maryland, 2011
|
All instruments were recovered successfully, and data were retrieved and
processed using proprietary software from the instrument manufacturers and
MATLAB data analysis software. In the spring deployment all the instruments collected data throughout the deployment. Some data were lost
in the fall deployment; both WET Labs ECO sensors were incorrectly programmed to sample every 5 min instead of every 10 min, so this filled their memory
prematurely and stopped sampling on October 20. The YSI sonde deployed at Blackwater River
expended the battery capacity on November 20, about 20 days early. The other YSI battery performed better, allowing acquisition until the recovery.
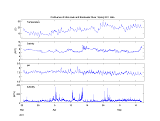
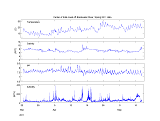
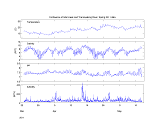
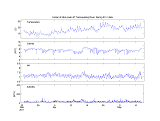
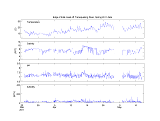
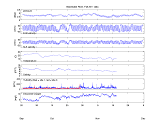
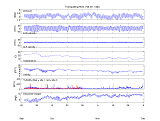
Figures 8, 9, and 10 show the time series plots of temperature, salinity, pH and turbidity data collected by the YSI sondes during the spring deployment at the Blackwater River sites. Figures 11, 12, and 13 show the time series plots of temperature, salinity, pH and turbidity data collected by the YSI sondes during the spring deployment at the Transquaking River sites. Figure 14 shows the time series plots of pressure, east and north components of current velocity, temperature, salinity, turbidity and dissolved oxygen data collected by the Aquadopp velocity profilers and YSI sondes deployed on the Blackwater River during the fall deployment. Figure 15 shows the time series plots of pressure, east and north components of current velocity, temperature, salinity, turbidity and dissolved oxygen data collected by the Aquadopp velocity profilers and YSI sondes deployed on the Transquaking River during the fall deployment. In figures 14 and 15, color is used to distinguish between data from two sites: red indicates the upstream site, blue indicates the downstream site. In all figures, gaps in the plot indicate sensor malfunction or dryness at low tide. Data collected were edited to remove spurious spikes, signals with biological fouling, and periods when an instrument was out of the water as determined by conductivity being near 0. Data were then converted to EPIC-compliant variables and placed into NetCDF format. NetCDF files allow for sharing of data in a common format that is machine-independent and contains appropriate metadata. Documentation of the USGS Oceanographic Time-Series Measurement Database can be found in Open-File Report 2007-1194 (http://woodshole.er.usgs.gov/pubs/of2007-1194/). The data are publicly served at http://stellwagen.er.usgs.gov/bw2011.html, which contains details of all field activities associated with this project, Google Earth visualizations of deployment locations, and sampling interval information. The edited, final data files can be accessed using OpenDAP at http://stellwagen.er.usgs.gov/opendap/bw2011/. File naming conventions for time series observations are described at http://woodshole.er.usgs.gov/pubs/of2007-1194/html/filenaming.html. Data in formats that did not conform to the structure of the Time-Series Measurement Database can be found in the appendix. |
|