U.S. Geological Survey Open-File Report 2012-1099
Summary of Oceanographic and Water-Quality Measurements near the Blackwater National Wildlife Refuge, Maryland, 2011
| Click on figures for larger images |
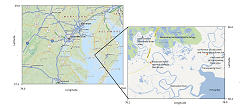 |
| Figure 1. Map of the region (left) with an inset showing the experimental area with sites on the Blackwater and Transquaking Rivers marked. © 2012 Mapquest, © 2012 Google. |
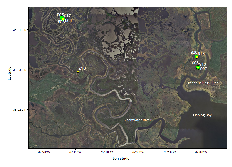 |
| Figure 2A. Image showing the entire experimental area with mooring ID's shown. The upstream sites are indistinguishable at this scale, but enlargements of the upstream regions (2B and 2C) show the detail. Green markers indicate the sites used in the spring deployment, and yellow ones the fall. This figure was created with ESRI ArcGIS using the i-cubed Nationwide Prime database (June 2012). |
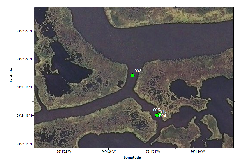 |
| Figure 2B. Enlargement of the Blackwater River upstream sites with mooring ID's shown. Green markers indicate the sites used in the spring deployment, and yellow one the fall. This figure was created with ESRI ArcGIS using the i-cubed Nationwide Prime database (June 2012). |
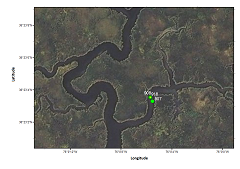 |
| Figure 2C. Enlargement of the Transquaking River upstream sites with mooring ID's shown. Green markers indicate the sites used in the spring deployment, and yellow one the fall. This figure was created with ESRI ArcGIS using the i-cubed Nationwide Prime database (June 2012). |
|
This
report presents oceanographic and water-quality observations measured at
several locations near the Blackwater National Wildlife Refuge (BNWR) in
Maryland during spring and fall of 2011 (fig. 1). Wetlands within BNWR have been
experiencing rapid disintegration due to multiple factors, including sea-level
rise, atmospheric forcing, and invasive species (Stevenson and
others, 1985). The suspended-sediment concentrations and net fluxes to and
from wetlands may provide insight into the relative stability. Therefore
we occupied sites in two contrasting wetland complexes: one adjacent to the
Blackwater River, and a more stable complex adjacent to Fishing Bay and
the Transquaking River.
Study sites on both rivers were occupied in both spring and fall (fig. 2A). Because the scale of figure 2A is too large to show detail of the upstream sites, enlargements of these areas are provided (Blackwater River fig. 2B; Transquaking River fig. 2C). Between March and May 2011, continuous measurements were collected at three sites in the Blackwater complex (moorings 903, 904, 905) and three sites in the Fishing Bay complex (moorings 906, 907, 908). Between September and October 2011, continuous measurements were collected at two sites in the Blackwater complex (moorings 916, 917) and two sites in the Fishing Bay complex (moorings 915, 918). Parameters measured include water level, velocity, salinity, temperature, pH, disolved oxygen and turbidity. |


