U.S. Geological Survey Open-File Report 2012-1099
Summary of Oceanographic and Water-Quality Measurements near the Blackwater National Wildlife Refuge, Maryland, 2011
| Click on figures for larger images |
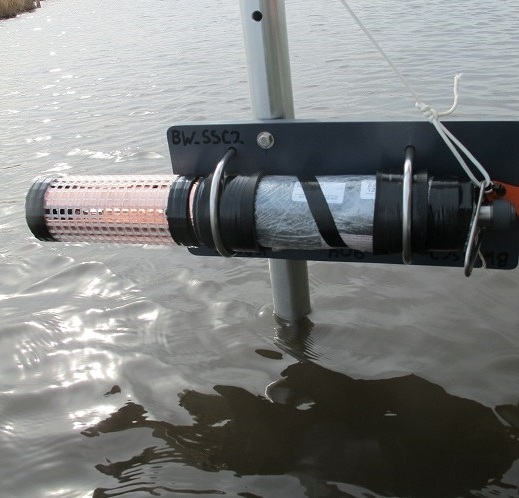 |
| Figure 3. Pole mounted YSI sonde prior to spring 2011 deployment. |
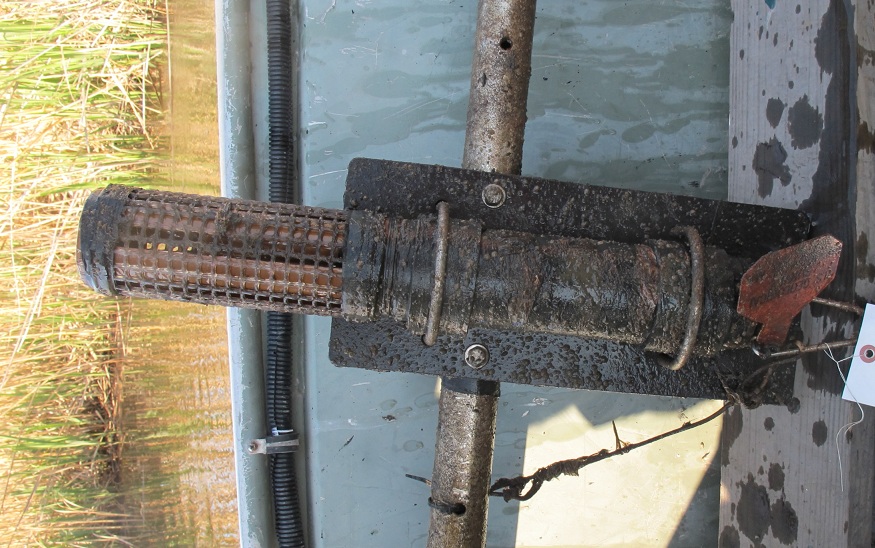 |
| Figure 4. Fouling on a YSI sonde after recovery in spring.
|
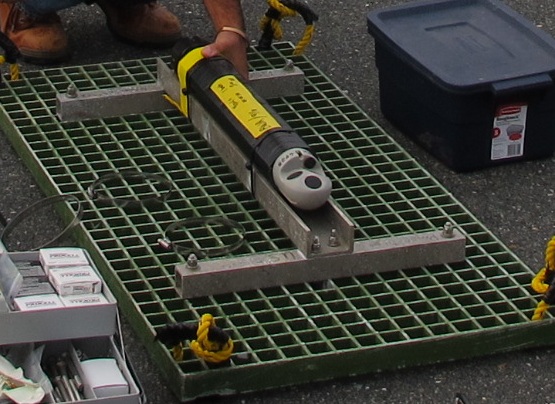 |
| Figure 5. Aquadopp velocity profiler as deployed on a grid platform in the fall (moorings 915, 916). |
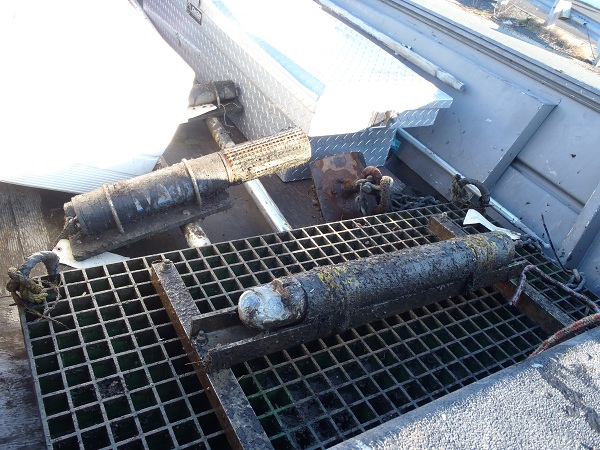 |
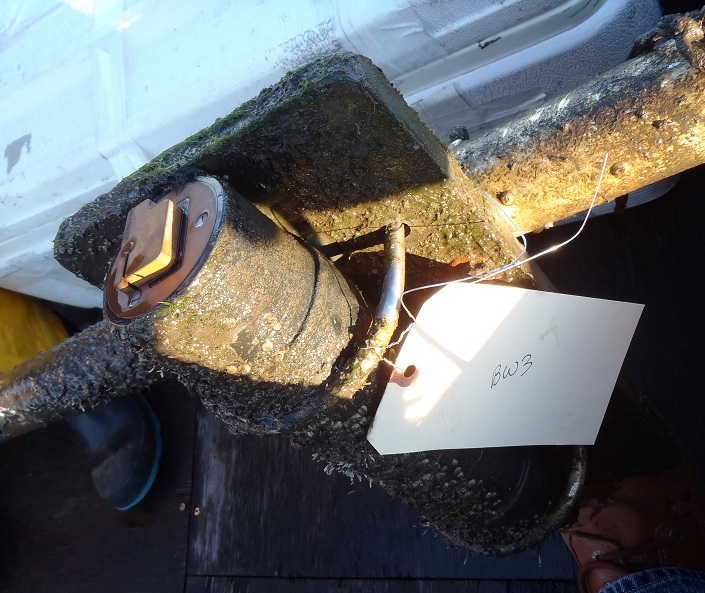
| Figure 6. Fouling on a bottom-mounted Aquadopp velocity profiler and a pole-mounted YSI sonde (background)) after fall recovery.
|
 |
| Figure 7. WET Labs ECO BB turbidity sensor after fall recovery. The wiper has kept the optical element clear of fouling.
|
|
In this experiment, autonomous instruments, with self-contained power and memory storage, were deployed at multiple sites in spring and fall at the Blackwater National Wildlife Refuge in Cambridge, Md. The measurements were collected to quantify sediment flux and included water temperature, salinity, velocity, pressure (depth), dissolved oxygen, pH, and turbidity. We used YSI 6-series multiparameter sondes, autonomous water-quality sensor that can measure a variety of parameters with interchangeable probes for the hydrographic measurements. Nortek aquadopp velocity profilers were deployed on the channel bottom to measure vertical profiles of stream flow, and WET Labs ECO BB turbidity sensors with wipers were deployed to provide a different form of turbidity measurement and test these sensors, which were new to us. Deployment-specific details are given in the sections below. The experiment log details the instrument serial numbers and data files collected. Additional information on data processing, quality assurance and control protocols, file formats, nomenclature and access methods used by the U.S. Geological Survey (USGS) Woods Hole Coastal and Marine Science Center Sediment Transport Group is provided in OFR 2007-1194 (Montgomery and others, 2007). Spring 2011For the spring deployment, pole-mounted YSI model 6290 sensors were configured to measure temperature, conductivity, pH, and turbidity every 10 minutes (min). The instruments were mounted horizontally on poles (fig. 3) that were pushed into the mud so the sensors were 0.35 meters (m) above the channel bottom. One YSI sonde was deployed at each of three sites on the Blackwater River near the junction of a tidal creek (IDs 903, 904, 905), and at each of three sites on the Transquaking River (one downstream near Fishing Bay, ID 906 and two further upstream, IDs 907, 908). The degree of fouling typical of these 60-day deployments is shown in figure 4. Additional details of these probes can be found at the manufacturer’s Web site (http://www.ysi.com). Fall 2011In the fall deployment, two sites on each river were occupied, one downstream and one upstream. Selected sites used in the spring deployment were reoccupied, and a downstream site on the Blackwater River was added. A YSI model 6600 sonde and a Nortek Aquadopp velocity sensor were deployed at each downstream site (IDs 915, 916). A WET Labs ECO BB turbidity sensor was deployed at each upstream site (IDs 917, 918). The YSI sensors were deployed on the same pole mounts that were employed in the spring. They were configured to measure temperature, conductivity, dissolved oxygen, and turbidity every 10 min. The Nortek Aquadopp profiler measures water velocity at multiple distances from the head, along with pressure. The Aquadopp measures the Doppler shift that occurs when three acoustic beams reflect from scatterers that are carried by the water. Because Doppler shift is proportional to the component of water flow along the beam, trigonometry can be used to convert the returned signal into eastward, northward, and vertical components of water flow. Additional details of these probes can be found at the manufacturer’s Web site (http://www.nortek-as.com). During the fall deployment, Nortek Aquadopps operating at 1 megahertz (MHz) were deployed on bottom-mounted grid platforms, looking upward (fig. 5) to measure currents throughout the water column. The instrument was configured to record 5 min averages of water flow every 15-min in 0.5-m bins. The first bin was located 0.7 m above the bottom. The degree of fouling on both the YSI and Aquadopp from the 70-day deployment is shown in figure 6. WET Labs ECO BB turbidity sensors are optical sensors that employ scattering from suspended materials in the water to compute turbidity. The probes are available with an integrated anti-fouling wiper to maintain high quality measurements. Additional details of these probes can be found at the manufacturer’s Web site (http://www.wetlabs.com). The ECO BB sensors (with wiper) were deployed on pole mounts similar to those used with the YSI sondes during the fall deployment. The poles were inserted into mud so the sensor was located nominally 0.5 m below the water surface. The sensors sampled for 10 seconds at 1 hertz (Hz) every 5 min. The degree of fouling on ECO BB is shown in figure 7; note how clean the end with the wiper is (upper left of photo). |


