 |
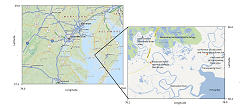
Figure 1. Map of the region (left) with an inset
showing the experimental area with sites on the Blackwater and Transquaking Rivers marked. © 2012 Mapquest, © 2012 Google |
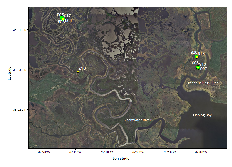 |
Figure 2A. Image showing the entire experimental area with mooring ID's shown. The upstream sites are indistinguishable at this scale, but enlargements of the upstream regions (2B and 2C)
show the detail. Green markers indicate the sites used in the spring deployment, and yellow ones the fall. This figure was created with ESRI ArcGIS using the i-cubed Nationwide
Prime database (June 2012).
|
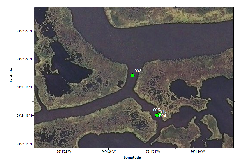 |
Figure 2B. Enlargement of the Blackwater River upstream sites
with mooring ID's shown. Green markers indicate the sites used in the spring deployment, and yellow ones the fall. This figure was created with ESRI ArcGIS using the i-cubed Nationwide
Prime database (June 2012).
|
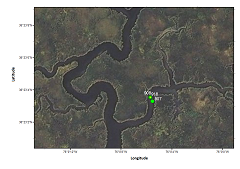 |
Figure 2C. Enlargement of the Transquaking River upstream sites
with mooring ID's shown. Green markers indicate the sites used in the spring deployment, and yellow ones the fall. This figure was created with ESRI ArcGIS using the i-cubed Nationwide
Prime database (June 2012).
|
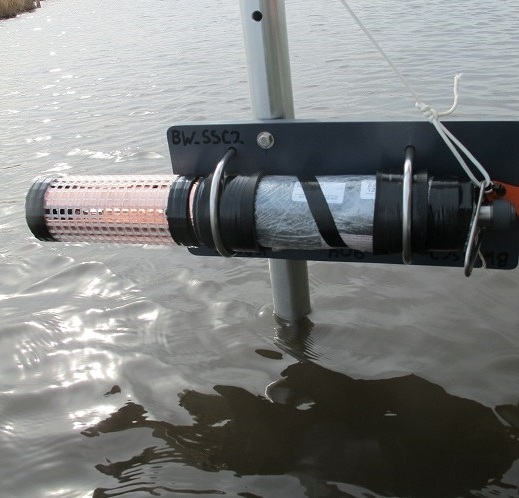 |
Figure 3. Pole mounted YSI sonde prior to spring 2011 deployment. |
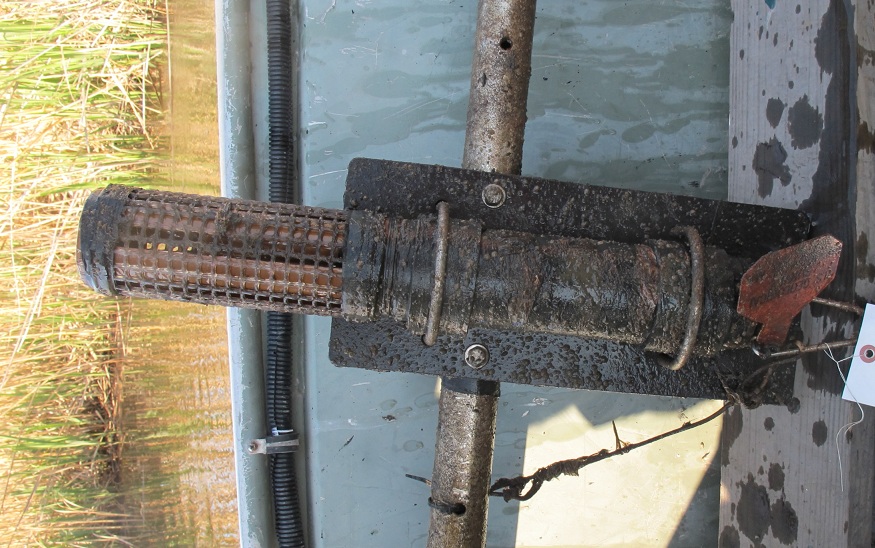 |
Figure 4. Fouling of a YSI sonde after recovery in spring.
|
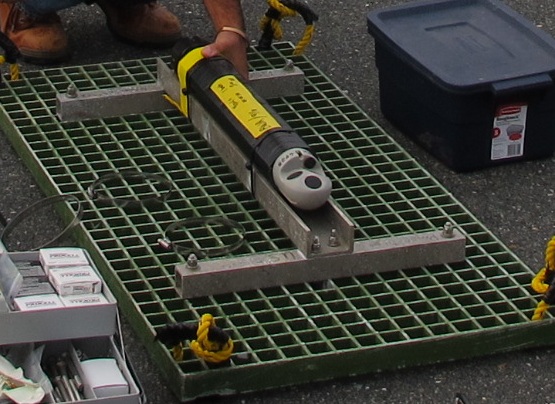 |
Figure 5. Aquadopp velocity profiler as deployed on a grid platform in the fall (moorings 915, 916). |
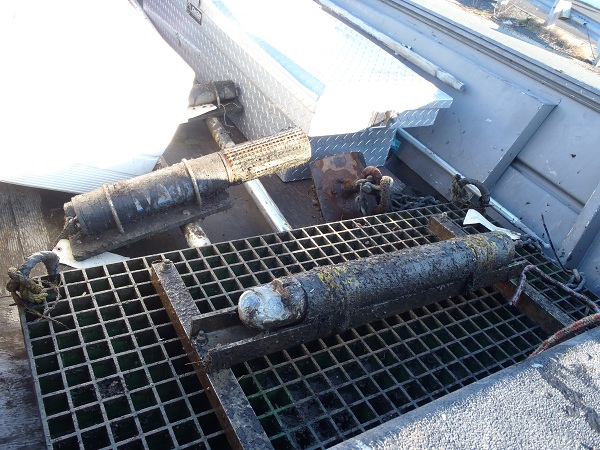 |
Figure 6. Fouling on a bottom-mounted Aquadopp velocity profiler and a pole-mounted YSI sonde (background))after fall recovery
|
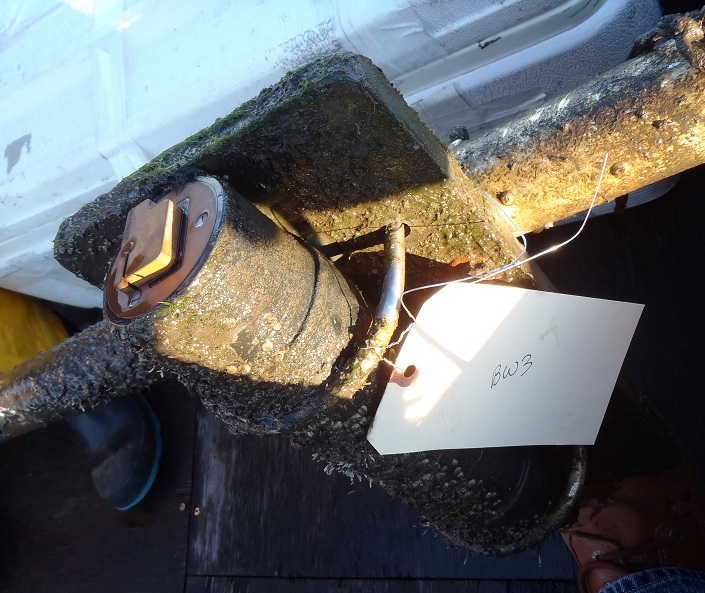 |
Figure 7. WET Labs ECO BB turbidity sensor after fall recovery. The wiper has kept the optical element clear of fouling.
|
 |
Figure 8. Time series plot of water temperature, salinity, pH, and turbidity,
from Blackwater River site at the confluence of tidal creek (mooring 903) |
 |
Figure 9. Time series plot of water temperature, salinity, pH, and turbidity, from the center of a tidal creek off Blackwater River (mooring 904) |
 |
Figure 10. Time series plot of water temperature, salinity, pH, and turbidity, from the edge of a tidal creek off Blackwater River (mooring 905) |
 |
Figure 11. Time series plot of water temperature, salinity, pH, and turbidity, from the Transquaking River site at the confluence of tidal creek (mooring 906) |
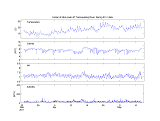 |
Figure 12. Time series plot of water temperature, salinity, pH, and turbidity, from center of a tidal creek off Transquaking River (mooring 907) |
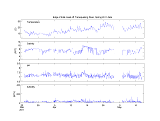 |
Figure 13. Time series plot of water temperature, salinity, pH, and turbidity, from the edge of a tidal creek off Transquaking River (mooring 908) |
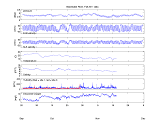 |
Figure 14. Time series plot of pressure, east velocity, north velocity, water temperature, salinity, turbidity
and dissolved oxygen from Blackwater River sites (moorings 915, 917). The turbidity data from the ECO BB sensor from upstream is overlaid in red on the turbidity data from the YSI sonde. |
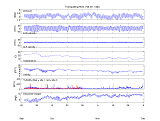 |
Figure 15. Time series plot of pressure, east velocity, north velocity, water temperature, salinity, turbidity and dissolved oxygen from
Transquaking River sites (moorings 916, 918). The turbidity data from the ECO BB from upstream is overlaid in red on the turbidity data from the YSI sonde. |


