Skip past header information
USGS - science for a changing world

U.S. Geological Survey Open-File Report 2012-1099

Summary of Oceanographic and Water-Quality Measurements near the Blackwater National Wildlife Refuge, Maryland, 2011


Skip past contents information/ Title Page / List of Figures / Conversion Factors / Abstract / Introduction / Instruments / Site Description / Mooring Log / Results / Acknowledgments / References Cited / Appendix


Figure 2A. Map of experimental area showing all sites.


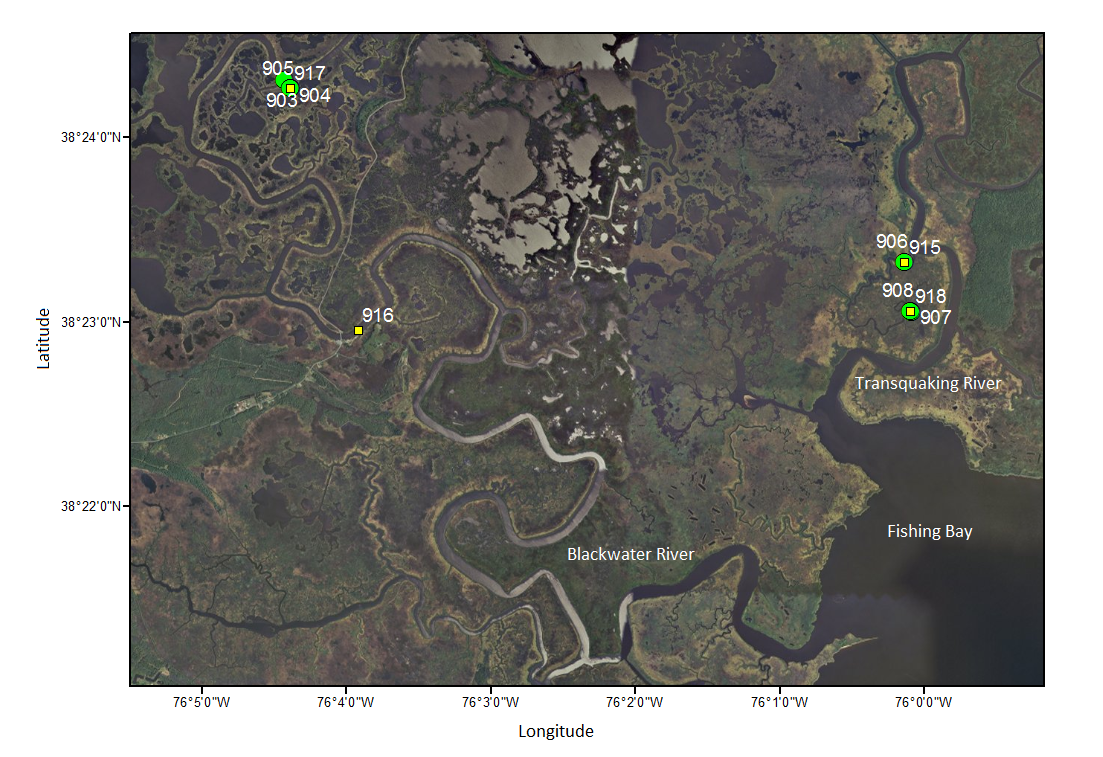
Figure 2A. Image showing the entire experimental area with mooring ID's shown. The upstream sites are indistinguishable at this scale, but enlargements of the upstream regions (2B and 2C) show the detail. Green markers indicate the sites used in the spring deployment, and yellow ones the fall. This figure was created with ESRI ArcGIS using the i-cubed Nationwide Prime database (June 2012).

Download the full size image in PDF format.


To view files in PDF format, download a free copy of Adobe Reader.


Skip USGS links group

Accessibility FOIA Privacy Policies and Notices

Take Pride in America logo USAGov logo U.S. Department of the Interior | U.S. Geological Survey
End of USGS links group