U.S. Geological Survey Open-File Report 2012-1234
Application of a Hydrodynamic and Sediment Transport Model for Guidance of Response Efforts Related to the Deepwater Horizon Oil Spill in the Northern Gulf of Mexico Along the Coast of Alabama and Florida
Title Page | Contents | List of Figures | List of Tables | Conversion Factors | Abbreviations | Executive Summary | Introduction | Methods | Results | Digital Data Files | Discussion | Summary and Conclusions | References Cited | Appendix 1. Scenarios | Appendix 2. Example Model Input Files | Appendix 3. Calculations of Mobility and Potential Flux | Appendix 4. File Naming Conventions | Appendix 5. Time Step of Maximum Ebb and Flood for Inlets in the Model Domain
 |
||
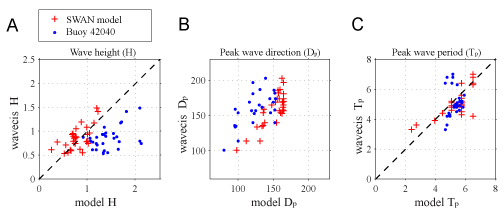
| Figure 14. Model predictions of A, wave height (H), B, peak wave direction (Dp), and C, peak wave period (Tp) in the northern Gulf of Mexico alongshore Alabama and Florida for January 1525, 2007, compared with observations (wavecis) from a Naval Research Laboratory acoustic doppler current profiler at Santa Rosa Island, Florida. To demonstrate the accuracy of the model, we show the values from NDBC buoy 42040 offshore in the northern Gulf of Mexico as an alternative model for predicting nearshore values. Only cases where the measured nearshore wave height exceeded 0.5 meter are shown. | ||


