U.S. Geological Survey Open-File Report 2012-1234
Application of a Hydrodynamic and Sediment Transport Model for Guidance of Response Efforts Related to the Deepwater Horizon Oil Spill in the Northern Gulf of Mexico Along the Coast of Alabama and Florida
Title Page | Contents | List of Figures | List of Tables | Conversion Factors | Abbreviations | Executive Summary | Introduction | Methods | Results | Digital Data Files | Discussion | Summary and Conclusions | References Cited | Appendix 1. Scenarios | Appendix 2. Example Model Input Files | Appendix 3. Calculations of Mobility and Potential Flux | Appendix 4. File Naming Conventions | Appendix 5. Time Step of Maximum Ebb and Flood for Inlets in the Model Domain
 |
||
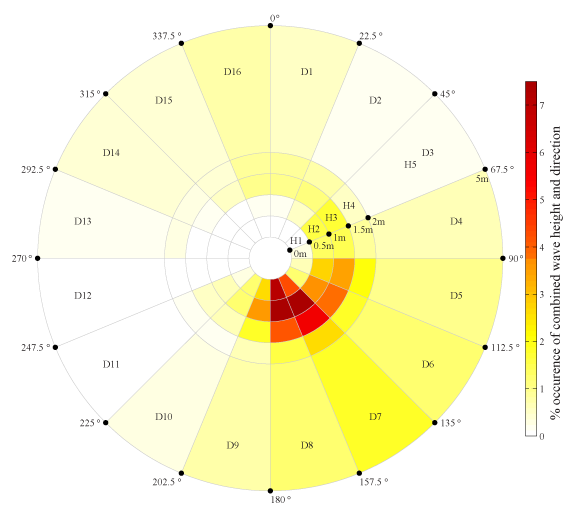
| Figure 2. Schematization of wave height and direction observations from NDBC buoy 42040 for April 1, 2010, to August 1, 2012. Colors indicate the percentage (%) of the occurrence for each wave height-direction bin. Wave height bins (numbered H1H5) are organized from the center outward with larger waves (2 m and higher) in the outer ring (H5). Wave direction bins (numbered D1D16) each span 22.5 degrees (°), from 0° to 360°, labeled around the circumference of the diagram. | ||


