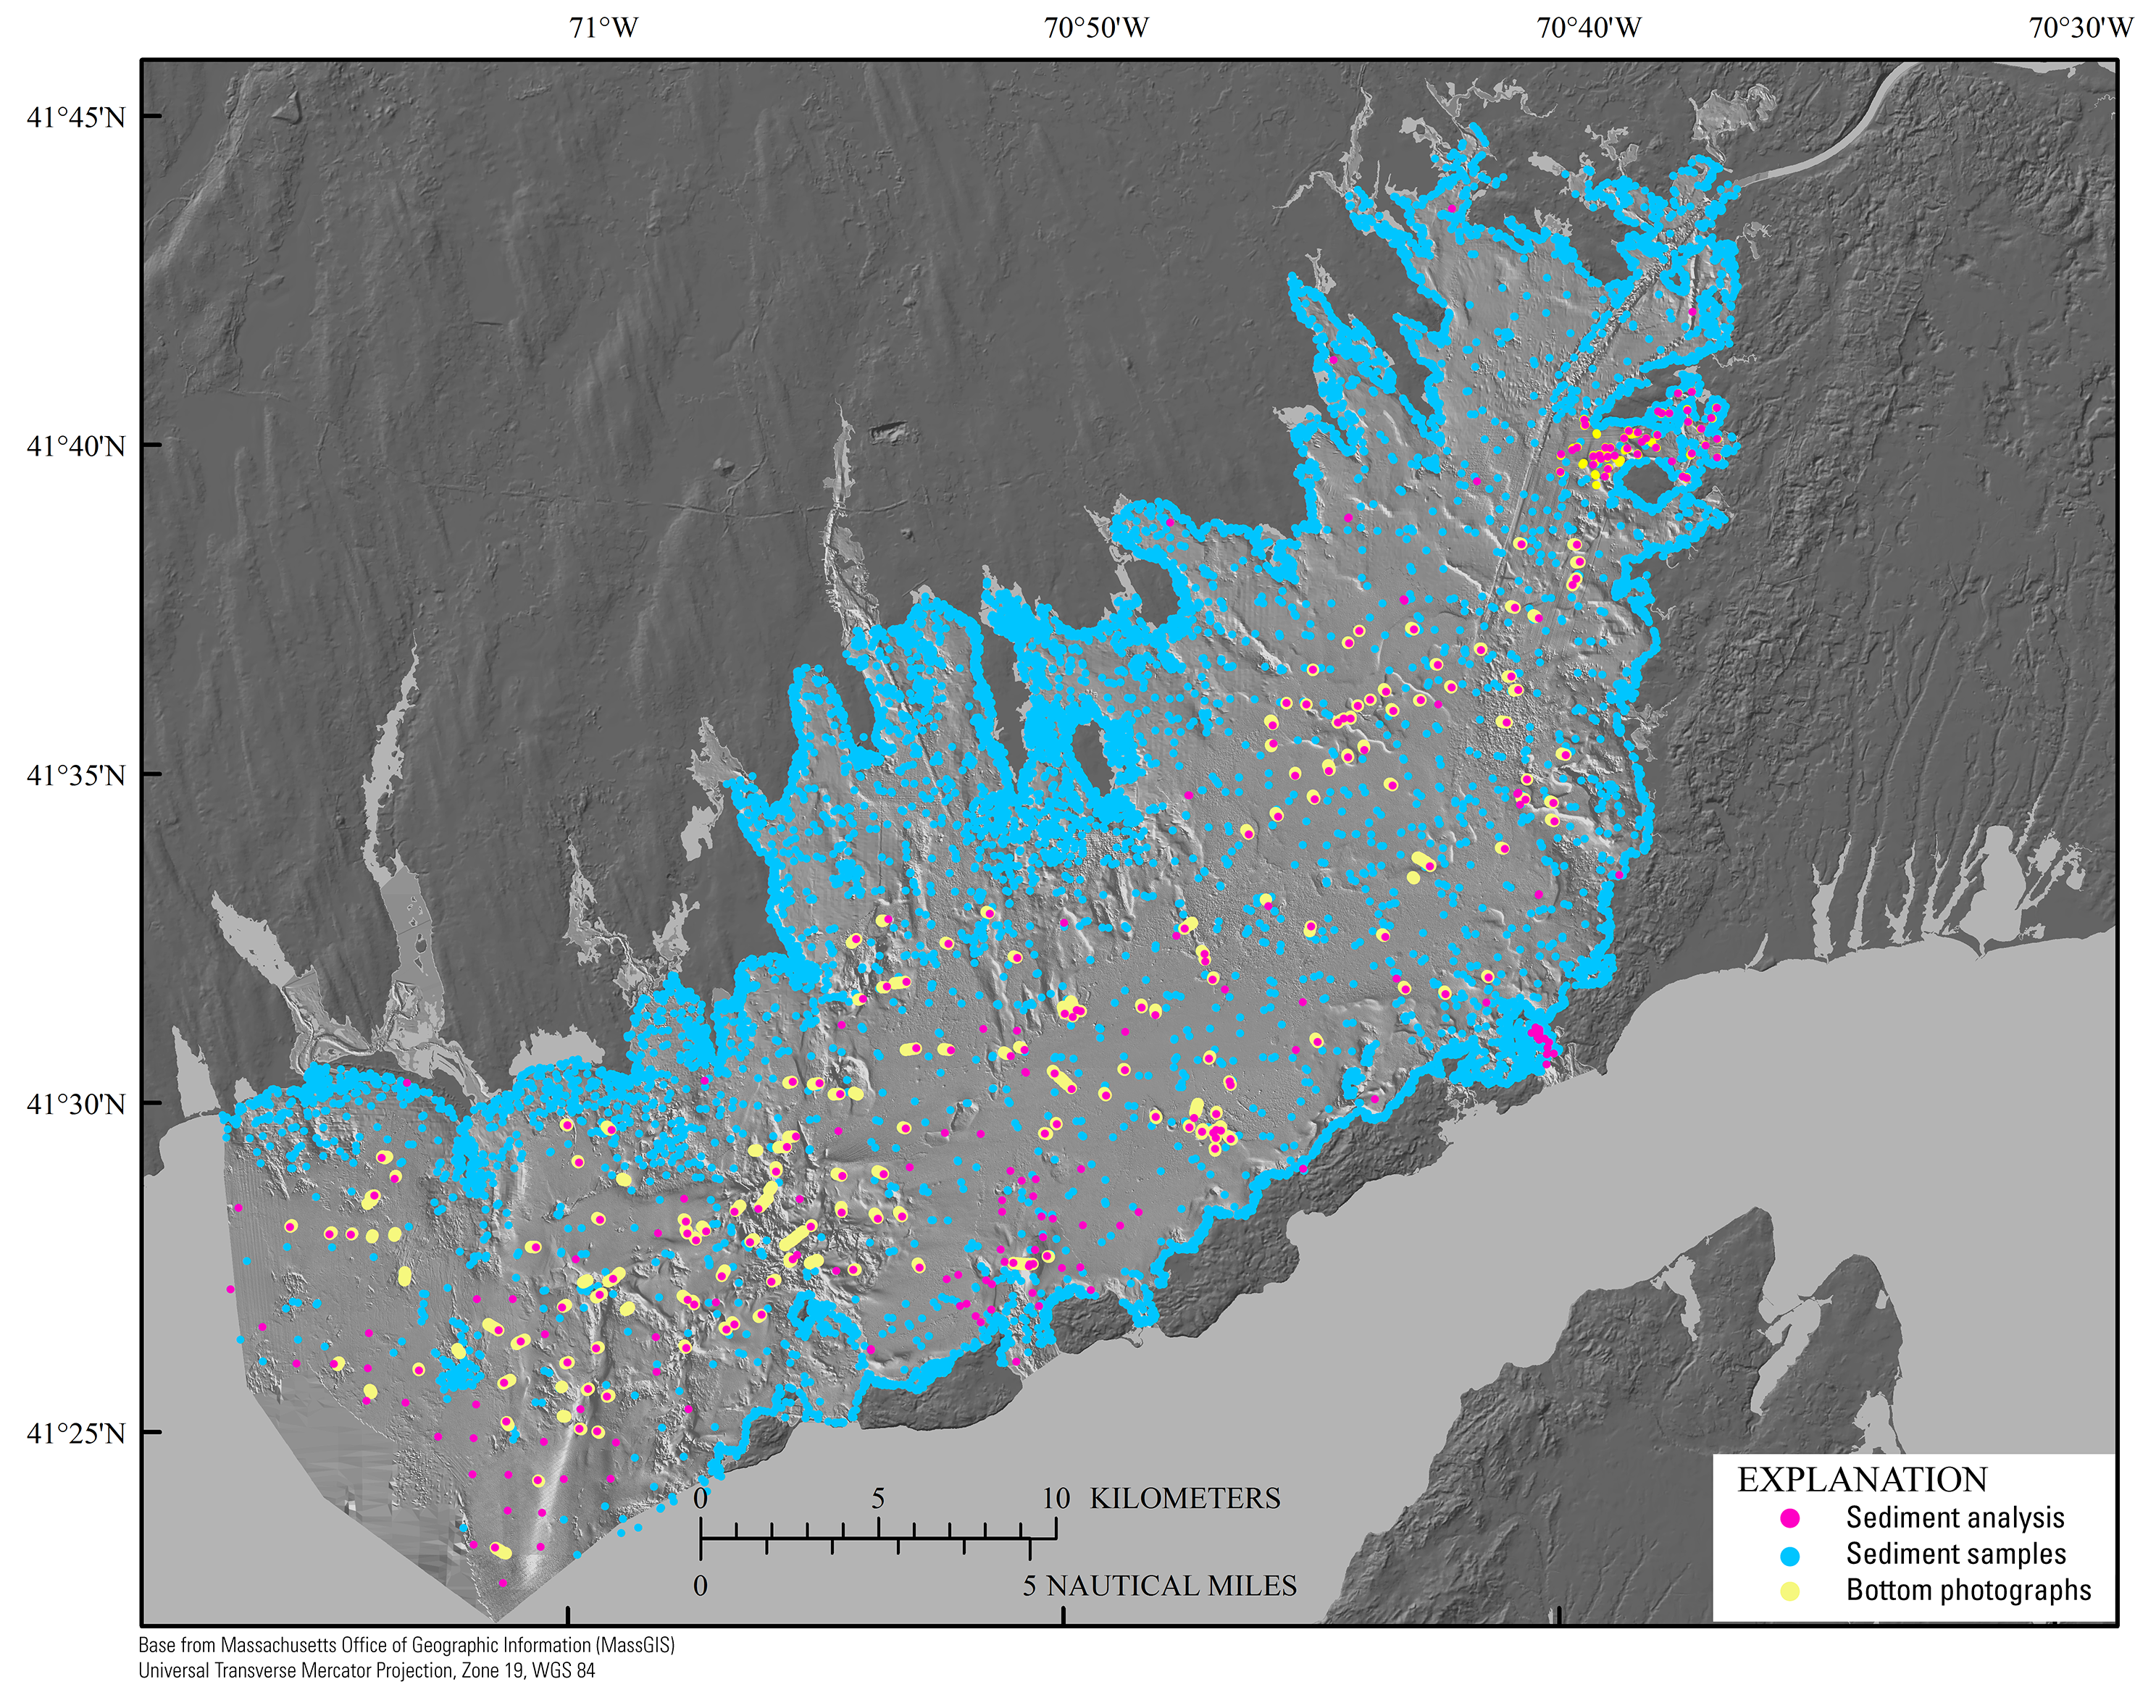
Figure 7. Map showing locations of bottom photographs and sediment samples collected within the study area to aid interpretations. Sediment samples analyzed in a laboratory are shown as magenta dots, whereas blue dots are locations of where samples have visual descriptions only (Ford and Voss, 2010; McMullen and others, 2011; Massachusetts CZM, unpub. data, 2012). Those processed in a laboratory to obtain grain-size statistics are preferred over those that were only described visually. Bottom photograph locations are generally associated with sites where samples were collected and grain-size statistics were processed. In rocky areas, visual descriptions were the only means to describe sea-floor sediments, as direct sampling was not possible given the large size of material on the seafloor. The bathymetry hillshade relief map is modified from the composite bathymetry of Buzzards Bay (fig. 3).
|