Open-File Report 2014-1220
Shallow Geology, Sea-Floor Texture, and Physiographic Zones of Buzzards Bay, Massachusetts
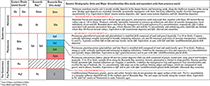
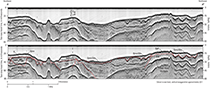
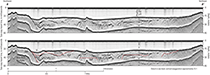
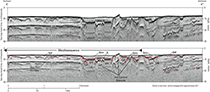
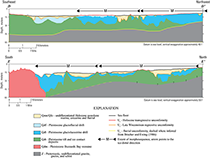
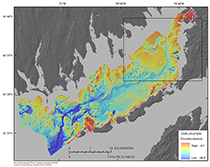
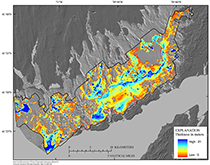
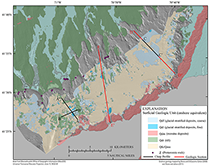
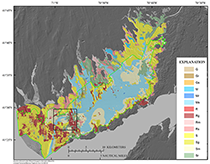
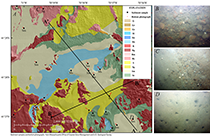
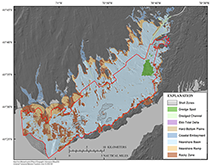
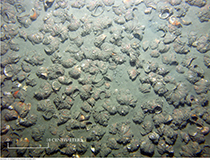
Three major seismic stratigraphic units are separated by three medium- to high-amplitude seismic reflections (fig. 9). Interpreted seismic profiles (figs. 10, 11, and 12) illustrate the typical geometry of the seismic units and their bounding seismic reflections throughout Buzzards Bay. For multiple reasons, the deepest observed seismic reflection (U1) is only seen on the seismic profiles in northeastern Buzzards Bay and is resolved primarily on boomer profiles. U1 is usually not detected on the chirp profiles because of a lack of penetration through the overlying units. The boomer profiles were only collected in northeastern Buzzards Bay, with the exception of one line between Quicks Hole and New Bedford (fig. 5). U1 deepens to the southeast, where eventually it could not resolved because of limited seismic penetration. U1 is high amplitude and irregular, with numerous diffractions along its extent. U1 was considered to be acoustic basement, because no reflections were observed below U1. The major seismic stratigraphic unit Qd is bounded by reflections U1, below, and Ur, above. While the base of this unit, U1, was not mapped over most of Buzzards Bay, Ur was mapped throughout Buzzards Bay, making the major unit Qd the most extensive unit mapped. The major unit Qd is divided into four different subunits (Qdm, Qdt, Qdl, and Qdf) on the basis of their seismic facies, defined by internal reflections. Subunits Qdm and Qdt have similar seismic facies and are distinguished on the basis of their geographic locations. All four of these units can be present or absent at any one location. Qdm and Qdt share the same lowest stratigraphic position within Qd. They also have the same seismic facies. Qdm is separated from Qdt on the basis of Qdm being proximal to the Elizabeth Islands. The chirp data did not consistently penetrate the top of Qdm and Qdt (figs. 10, 11, and 12). The top of Qdm and Qdt was recognized as a strong, highly irregular reflection; however, in places the chirp data show some irregular and discontinuous internal reflections. Irregular reflections and hyperbolic diffractions within Qdt and Qdm were seen in the boomer data. Where these units intersect the sea floor, diffractions were observed just above the surrounding sea floor. Mapping the extent of the upper surface of Qdt was limited or not possible where thick units overlay it or where it was obscured by the primary sea-floor multiple. The top of Qdt/Qdm forms ridges and local highs, which are buried or partially buried by younger deposits and, in places, exposed at the sea floor. The structure of this upper surface subdivides several subsurface basins within Buzzards Bay. Qdl, a subunit within Qd above subunits Qdm and Qdt, typically fills the subsurface basins formed at the top of Qdm and Qdt. Qdl was clearly identified by highly rhythmic and parallel internal reflections (fig. 10,12) that typically drape the irregular reflection at the top of Qdm/Qdt. Qdf, the uppermost subunit within Qd, typically overlies Qdl. Qdf contains undulating to discontinuous reflections, although the unit may be acoustically amorphous in places. Locally the base of Qdf has a strong irregular reflection that truncates reflections within Qdl. Limited penetration of the chirp profiles and interference from primary multiples restricted mapping of the bases Qdl and Qdf over the entire study area although their surface and subsurface extents were mapped. The regional seismic reflection Ur bounds the top of Qd. This medium- to high-amplitude, irregular to undulating reflection typically truncates underlying reflections within Qd. U1 deepens towards the center of the basin and towards the mouth of Buzzards Bay, reaching a minimum elevation of 46 m at the bay mouth. As a result, Ur forms a subsurface basin within Buzzards Bay. At the deepest valleys of this basin, Ur is typically attenuated by acoustic wipe-out zones. The basin structure formed by Ur is partially filled with a major seismic stratigraphic unit Qfe/Qmn. The subunit Qfe fills the valleys formed by Ur. It produces variable seismic signatures that typically consist of laminated, horizontal to concave-up reflectors or zones of near acoustic transparency (fig. 12). Qfe is thickest in the valleys formed by Ur. The seismic reflection Ut generally defines the upper surface of subunit Qfe. Ut typically is a medium-amplitude, flat and continuous reflection. Ut merges with Ur along the flanks of the basin where the reflection takes on the irregular, higher amplitude character of Ur. Poor data quality and acoustic attenuation zones obscured the seismic reflections within and just above Qfe, including the reflection Ut . As a result, individual regional mapping of Ut and the subunits Qfe and Qmn was not possible. The uppermost subunit Qmn’s lower boundary is defined by Ut and typically overlies the subunit Qfe. The subunit Qmn contains laminated, horizontal internal reflections near the base and becomes more transparent in the upper part of the subunit. The subunits Qfe and Qmn are combined and mapped as one major seismic stratigraphic unit. Geologic Interpretation and Seismic Stratigraphic MappingCorrelations between this study and preexisting seismic stratigraphy and geologic interpretations (Robb and Oldale, 1977; O’Hara and Oldale, 1980) are summarized in figure 9. Our geologic interpretations of the seismic stratigraphy are largely unchanged from the interpretations of these previous studies. Because our data provide higher levels of spatial resolution, these data present more detailed surficial and subsurface geologic maps than were previously available. Three major seismic stratigraphic units, Proterozoic bedrock (Z), glacial drift (Qd), and postglacial deposits (Qfe/Qmn), are separated by two regional unconformities (reflectors) defined by reflections U1 and Ur (fig. 10). In addition, glacial drift (Qd) is divided into subunits according to seismic facies, and Qfe/Qmn is divided into subunits by a regional unconformity defined by the reflection at Ut. Z, inferred to be undifferentiated Proterozoic bedrock on the basis of what has been mapped onshore (Zen and others, 1983), was the deepest unit observed on the seismic profiles. The upper surface of Z was seen as a reflection, U1, which has a highly irregular and diffracted character. U1 is overlain by glacial till and ice-contact deposits (Qdt or Qdm) or stratified drift (Qdl and Qdf). Qdt includes Pleistocene glacial till and ice-contact deposits, and Qdm includes till and ice-contact deposits of the Buzzards Bay moraine. Irregular reflections and hyperbolic diffractions within Qdt and Qdm and where these units intersect the sea floor were interpreted as acoustic signatures of boulders. Pleistocene stratified glacial drift includes the units Qdl (Pleistocence glaciolacustine) and Qdf (glaciofluvial), which were deposited by glacial meltwater. Qdf typically overlies Qdl, and in places a local glaciofluvial erosional unconformity at the base of Qdf dissects Qdl (fig. 13). The discontinuous and undulating reflections within Qdf are cut-and-fill features that have eroded Qdl in places. Ur is the late Wisconsinan to early Holocene regressive unconformity, which was initially formed by proglacial lake drainage and by ice-distal meltwater fluvial erosion and was later modified by continued subaerial fluvial erosion until the early Holocene. This postglacial drainage surface (fig. 14) shows a single main channel originating from points at the head of the bay and associated tributary channels. Towards the mouth of the bay, this channel appears to bifurcate, having branches that flow through breaches in the complex topography formed by glacial drift. Ur is a composite unconformity because it merges with Ut, primarily at the interfluves. Qfe was deposited within fluvial and later in estuarine environments with the onset of the marine transgression. Qfe fills the fluvial valleys incised by Ur into the surface of Pleistocene glacial deposits. Qfe is thickest in the thalwegs of the fluvial-cut valleys and is thin to absent on interfluves. The maximum thickness of Qfe could not be determined where biogenic gas within Qfe attenuates the seismic reflections. Qmn is a posttransgressive Holocene nearshore marine unit overlying Ut and older stratigraphic units (figs. 10, 11, and 12). Qmn deposits are predominantly muddy within the deeper areas of the basin and are sandier close to shore or where paleoshorelines existed. We mapped the total thickness and distribution of postglacial sediment (Qfe and Qmn), which includes fluvial, estuarine, and marine deposits that are bounded by the Ur/Ut composite unconformity and the sea floor (fig. 15). The thickness ranges from 0 to 21 m. The thicknesses of dredge spoil deposits, which range from 0 to 4 m thick, were not included in the total postglacial sediment thickness. All thicknesses were calculated using a seismic velocity of 1,500 m/s. The postglacial sediment thickness (fig. 15), including thickness of dredge spoil, was subtracted from a regional swath-bathymetry DEM (fig. 3) to produce a structure surface of the top of glacial deposits relative to NAVD 88 (fig. 14). The surficial geologic map (fig. 16) was derived by mapping the aerial extent of units that crop out at the sea floor. Sea-floor acoustic backscatter, sediment samples and photographs, and sea-floor morphology were all considered as supporting evidence for the stratigraphic interpretation. Sediment Texture and DistributionUsing the classification scheme of Barnhardt and others (1998) (fig. 6), sediment type was mapped over 696 square kilometers (km2) (fig. 17). All units except for Gm and Mg were mapped in the study area. Sixty-four percent of Buzzards Bay study area has coverage with high-confidence, high-density geophysical data and high-quality sample data (fig. 8; table 2). The remaining area, mostly in water depths less than 5 m, only has lead-line and single-beam sonar bathymetry and mostly qualitative descriptions of sediment samples or no sediment sample data. The areas of high confidence (fig. 8; table 2) are combined and indicated as a single polygon on the sediment-type map (fig. 17). All four levels of confidence are attached within the geospatial data file for sediment texture in the appendix. Figure 17 shows a sediment-type map for a subarea of Buzzards Bay and provides examples of how high-quality geophysical data, quantitative sample data, and bottom photographs relate to the interpretation. Of the primary sediment types used in this study (Gravel, Sand, Mud and Rock), the Buzzards Bay sea floor is covered by 54 percent sand, 26 percent mud, 17 persent rock, and 3 percent gravel. Figure 17 shows the coverage of the primary and composite Barnhardt classification units. Separate polygons exist for the same sediment type where areas of high and low confidence meet (fig. 8). Along this boundary that was defined by confidence level, the sediment type can be inconsistent between adjacent high-confidence and low-confidence polygons, because in areas of low confidence, no backscatter data exist, bathymetry is low resolution, and no samples with grain-size analysis exist. In some low-confidence areas, only primary sediment types are mapped, which are adjacent to composite sediment types in areas of high confidence. Average gravel, sand, silt, clay, and phi size for each sediment texture polygon were calculated by using the combined average of the total number of sediment samples within the polygon. The average gravel, sand, and mud (silt and clay) for each polygon determined a sediment-type classification based on Barnhardt and others (1998). The average phi size for each polygon is supporting information and not considered in the classification. Only the 296 samples that include laboratory analysis were used for calculations in level-one high-confidence areas (fig. 8). In confidence-level-one polygons, the number of samples per polygon ranges from 1 to 59, with an average of 1.1 samples per km2. The total combined average gravel, sand, and mud for each polygon agrees with the polygon interpretation for the primary and composite units 74 percent of the time and the primary units alone 92 percent of the time. Variations within the interpreted units are expected over short distances. Consequently, perfect correlation between sediment samples and the interpretation should not be expected. Sediment texture statistics are within the geospatial data file for sediment texture provided in the appendix. Bottom photographs were used to document the presence of rocky areas where boulders, cobbles, and gravel are abundant on the sea floor and consequently sediment sampling is not feasible. Data on average phi size and average particle content by weight in rock and gravel areas should be used cautiously; in these areas, large particle sizes (cobble/boulders) prohibit sampling, and accurate quantitative information regarding the grain-size measurements is lacking. Some of the discrepancy between the interpreted units and sediment sample statistics can be explained by the interpretations being based on bottom photographs in gravelly areas (fig. 18). The surficial sediment texture map for Buzzards Bay (fig. 17) indicates sediment-type ranges from muddy postglacial marine sediments within the deeper, more protected environments to pebbles, cobbles, and boulders associated with the Buzzards Bay moraine and other areas where glacial drift (till and ice-contact deposits) are exposed. Coarse and fine-grained sediment exist in all water depths. Physiographic ZonesMapping of physiographic zones in the 725.4 km2 area (fig. 19) adapted the classification of Kelley and others (1998), which defined Nearshore Basins, Rocky Zones, Nearshore Ramps, and Hard-Bottom Plains. Zones added to the classification include Ebb-Tidal Deltas and Coastal Embayments and areas of anthropogenic impact, Dredged Channels and Dredge Spoil. In addition, zones of high carbonate-shell concentration (Shell Zones) were superimposed over physiographic zones as a separate layer and not included in the calculations of areal extent described below. Nearshore Basins (NB) are areas of shallow, low-relief sea floor adjacent to the mainland and separated from offshore areas by islands and shoals. Water depths range from 0 to 47 m. Along its landward margin, the basin sediment merges with the intertidal zone, often a Nearshore Ramp, in a gradational contact. Nearshore Basins cover 472.8 km2 of the Buzzards Bay basin, making this physiographic zone the most substantial by area (65 percent). Rocky Zones (RZ) are rugged areas of high bathymetric relief, rising above the Nearshore Basins, ranging from rocky ledges to relatively flat, gravel-covered plains, to boulder fields. Water depths range from 3 to 45 m. Although ledge and coarse-grained sediment are found within all physiographic zones defined here, they dominate the sea floor in Rocky Zones. Rocky Zone covers 116.5 km2 of Buzzards Bay and is the second largest zone by area (16 percent). Nearshore Ramps (NR) are areas of gently sloping sea floor with generally shore-parallel bathymetric contours. Water depths range from 0 to 29 m. This zone is covered primarily with sand-rich sediment, although small rocky ledge exposures, cobbles, and boulders crop out on the sea floor in places. Nearshore Ramps are mostly confined to cuspate shorelines between coastal headlands and typically grade into the Nearshore Basin. Nearshore Ramps cover 51.9 km2 of Buzzards Bay, 7 percent of the sea floor by area. Coastal Embayments (CE) include the coastal ponds described by FitzGerald and others (1987) along the northwest shore of Buzzards Bay and the smaller bays and harbors along the Cape Cod and Elizabeth Islands shores. Some of the shallow coastal water bodies, particularly the drowned river valleys along the northwest shore of Buzzards Bay, fit the description of coastal lagoons where these water bodies are separated from the ocean by a barrier but connected at least intermittently to the ocean with at least one restricted inlet (Kjerfve, 1994). FitzGerald and others (1994) would refer to the coastal water bodies along northwestern Buzzards Bay as embayments. In this report, we refer to all partially enclosed, shallow coastal water bodies along the Buzzards Bay margin as Coastal Embayments. Coastal Embayments cover 39.3 km2 along the peripheries of Buzzards Bay, 5.5 percent of the total area of Buzzards Bay. Hard-Bottom Plains (HBP) tend to have low bathymetric relief, with a coarse sediment texture consisting of primarily sand and gravel. Water depths range from 4 to 30 m. These zones cover 26.5 km2 of the sea floor, 3.6 percent of the total area of the Buzzards Bay sea floor. Dredge Spoil (DS) areas are where dredged materials have been dumped on the sea floor. These areas show irregular bathymetry, roughness, and acoustic backscatter that often contrast with the surrounding geology. Water depths range from 8 to 18 m. On the acoustic backscatter, circular footprints with associated trails identify individual sites where material was dumped. These features coalesce into larger areas of variable backscatter, which make up the core of the dumpsite. Thickness of the Dredge Spoil is mapped from the seismic data. The largest Dredge Spoil area mapped is in the vicinity of the Cleveland Ledge Disposal Site. This site covers more than 10.6 km2, which is more than 96 percent of the total 11 km2 area of Dredge Spoil mapped. Dredge Spoil covers 1.5 percent of the sea floor in Buzzards Bay. Dredged Channels (DC) are identified as angular, negative-relief bathymetric features, which cut through geomorphic features (fig. 3). Water depths range from 1 to 18 m. Dredged Channels are identified leading into the Cape Cod Canal, leading into New Bedford Harbor, and within Red Brook Harbor. Dredged Channels have altered 6.8 km2 (0.9 percent) of the sea floor physiography. Ebb-Tidal Deltas (ETD) are lobate sandy shoals found on the side of inlets that form through the interaction of waves and ebbing tidal currents flowing from Vineyard Sound. Water depths range from 1 to 14 m. The only Ebb-Tidal Deltas mapped within Buzzards Bay are on the bay side of tidal passages between the Elizabeth Islands. These features cover 0.6 km2, less than 0.1 percent of the total area. Shell Zones (SZ) areas have substantial coverage of carbonate shells. For Buzzards Bay, shell zones were mapped where high densities of slipper shells (Crepidula fornicata) cover the sea floor (fig. 20). These zones are primarily mapped by identifying high acoustic backscatter in areas where surficial sediments are fine grained and verified with bottom photographs (fig. 20). Areas identified include the central Buzzards Bay Nearshore Basin near Quicks Hole, the Nearshore Basin area outside of Red Brook Harbor, and within and around the Nearshore Basin bathymetric channels north of Penikese Island. Other areas of high concentrations of shell material likely exist but are not identifiable without bottom photographs. The Shell Zones identified cover 14.7 km2, which is 2 percent of the Buzzards Bay sea floor by area. Water depths range from 4 to 43 m, with a mean depth of 16 m. |

![]() U.S. Department of the Interior |
U.S. Geological Survey
U.S. Department of the Interior |
U.S. Geological Survey
URL: http://pubsdata.usgs.gov/pubs/of/2014/1220/ofr2014-1220-results.html
Page Contact Information: GS Pubs Web Contact
Page Last Modified: Wednesday, 07-Dec-2016 20:04:06 EST