Skip past header information
USGS - science for a changing world

Open-File Report 2014-1221


Geological Sampling Data and Benthic Biota Classification: Buzzards Bay and Vineyard Sound, Massachusetts


Skip past contents information Title Page / List of Figures / Conversion Factors / Abbreviations / Abstract / Introduction / Data Collection/Processing / Acknowledgments / References Cited / Appendix 1 / Appendix 2 / Appendix 3 / Index


Figure 4, map showing SEABOSS sampling sites overlaid on acoustic-backscatter intensity.


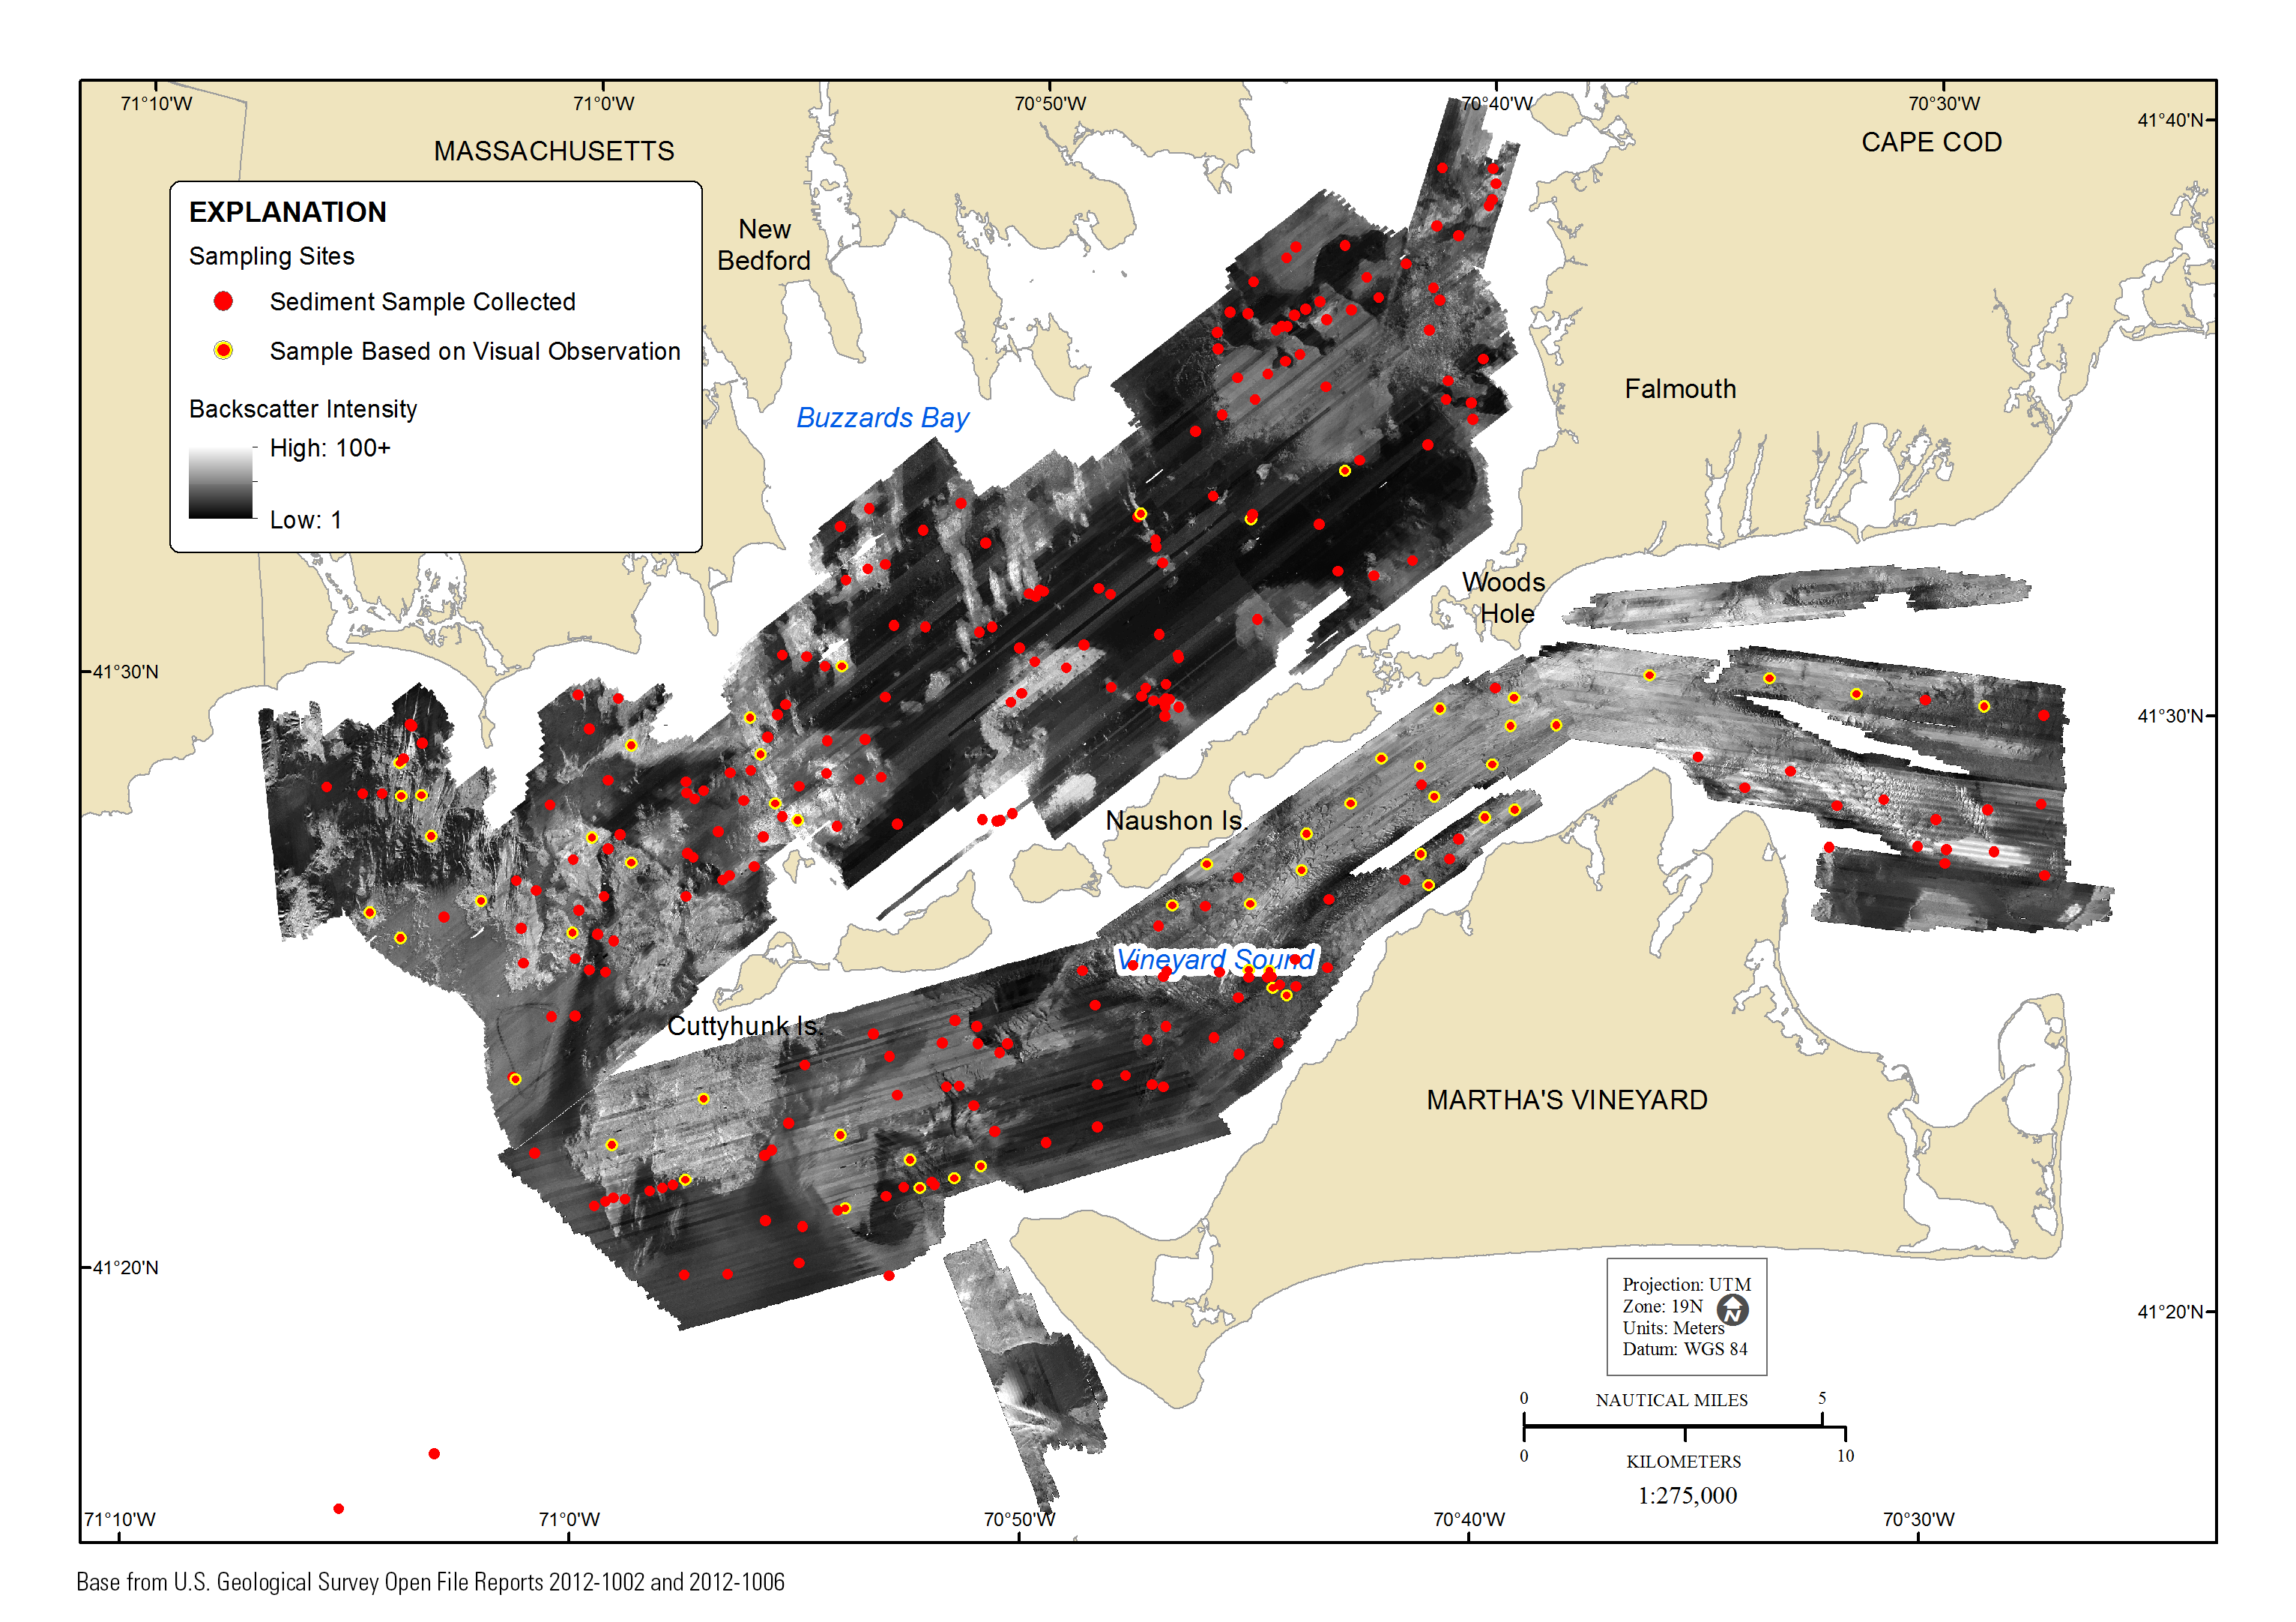
Figure 4. Map showing SEABed Observation and Sampling System (SEABOSS) sampling sites (red dots) overlaid on acoustic-backscatter intensity in the study area. Backscatter intensity is an acoustic measure of the relative hardness and roughness of the sea floor. In general, high values (light tones) represent rock, boulders, cobbles, gravel, and coarse sand. Low values (dark tones) generally represent fine sand and muddy sediment. Tonal variations can occur across track in the sidescan-sonar data as a result of changes in acquisition or processing parameters. Backscatter imagery is from U.S. Geological Survey Open-File Reports 2012–1002 and 2012–1006. Is., Island; UTM, Universal Transverse Mercator; WGS 84, World Geodetic System of 1984.

Accessibility FOIA Privacy Policies and Notices

Take Pride in America logo USA.gov logo U.S. Department of the Interior | U.S. Geological Survey
URL: http://pubsdata.usgs.gov/pubs/of/2014/1221/html/imagepages/ofr2014-1221-figure04.html
Page Contact Information: GS Pubs Web Contact
Page Last Modified: Wednesday, 07-Dec-2016 20:03:13 EST