
|
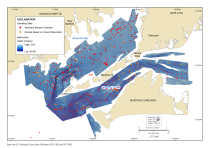 |
Figure 3. Map showing SEABed Observation and Sampling System (SEABOSS) sampling sites (red dots) over depth-colored shaded-relief topography of the sea floor in the study area. Bathymetry is from U.S. Geological Survey Open-File Reports 2012–1002 and 2012–1006. Is., Island; UTM, Universal Transverse Mercator; WGS 84, World Geodetic System of 1984. Click on figure for larger image. |
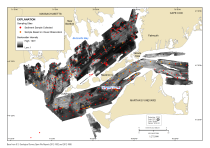 |
Figure 4. Map showing SEABed Observation and Sampling System (SEABOSS) sampling sites (red dots) overlaid on acoustic-backscatter intensity in the study area. Backscatter intensity is an acoustic measure of the relative hardness and roughness of the sea floor. In general, high values (light tones) represent rock, boulders, cobbles, gravel, and coarse sand. Low values (dark tones) generally represent fine sand and muddy sediment. Tonal variations can occur across track in the sidescan-sonar data as a result of changes in acquisition or processing parameters. Backscatter imagery is from U.S. Geological Survey Open-File Reports 2012–1002 and 2012–1006. Is., Island; UTM, Universal Transverse Mercator; WGS 84, World Geodetic System of 1984. Click on figure for larger image. |
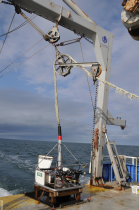 |
| Figure 5. Photograph of the SEABed Observation and Sampling System (SEABOSS) during survey 2010–005 aboard the research vessel Connecticut. The SEABOSS system was used to collect video, photographic data, and sediment samples. Click on figure for larger image. |
Data Collection and Processing
Survey Operations
The U.S. Geological Survey (USGS) collected seafloor sampling data from (USGS Field Activity 2010-005-FA) September 9-14, 2010 aboard the research vessel (R/V) Connecticut using the SEABed Observation and Sampling System (SEABOSS; Valentine and others, 2000) to ground-truth geophysical data at 301 sampling sites in Buzzards Bay and Vineyard Sound, Massachusetts (fig. 3). SEABOSS sites were chosen based on changes in dynamic range in the acoustic backscatter data and preliminary interpretations of other geophysical data collected between 2004-2010 (fig. 4).
The SEABOSS contains forward- and down-looking video cameras, a digital still camera, and a modified Van Veen sediment sampler. The elements of the SEABOSS are contained within a stainless steel framework measuring 110 x 110 centimeters (cm) and 118 cm tall, and weighing 167 kilograms (368 pounds) overall. The frame has a stabilizer fin that orients the system as it drifts over the seabed. The digital camera, a Minolta DiMAGE A2, is mounted in a machined Delrin housing with a flat port and is set for 3264 x 2448 pixel images at the "fine" setting for compression. The system also has a PHOTOSEA strobe. Two lasers are set 20 cm apart (both as they are mounted on the SEABOSS frame and as seen in photographs and video on the seabed) for scale measurements. The red laser dots can usually be seen in the photo depending on the bottom type and the distance to the seafloor. A third laser is positioned at an angle so that when it intersects the other lasers, the SEABOSS is at the optimum height (approximately 75 cm) off the bottom for a still photograph. The camera is set to a manual focus and set to a default focus distance once the camera is powered up. The default focus distance is slightly less than the optimum height above the seafloor to account for optical distortion under water. All of the system's elements are powered from the surface vessel through a conducting cable.
On this particular survey, the SEABOSS was deployed from the R/V Connecticut off the ship's A-frame on the stern (fig. 5). When the vessel arrived at a target site, the SEABOSS was deployed. At a typical site, the vessel and sampler drifted with the winds and currents for approximately 5-15 minutes, where continuous video was collected and higher-resolution still photographs were taken at random but usually at the start of a SEABOSS deployment, then at least one photo per minute, as well as just prior to taking a physical sediment sample. Typically at the end of a SEABOSS deployment, the system would be lowered to the seafloor triggering the sampler to close and collect a relatively undisturbed surficial sediment from the seafloor. Once recovered on the deck of the ship, the upper two cm of the sediment grab is subsampled using a calibrated stainless-steel shovel and stored for grain-size analysis at the USGS sediment laboratory at the Woods Hole Coastal and Marine Science Center.
Surficial Sediment Samples and Grain-Size Analyses
Surficial sediment samples were acquired at 246 of the 301 SEABOSS locations (figs. 3 and 4). Sediment samples were usually collected at the end of each camera tow, and samples were not typically collected in rocky areas. The upper 2 cm of sediment were bagged and taken to the USGS sediment laboratory for grain-size analysis. Grain-size analyses were completed using procedures outlined by Poppe and others (2005). These data include sample location, bulk weight, percent of sample in each 1-phi size class from -5 phi to 11 phi, sediment classification, kurtosis, and other sediment-related statistics. These data are available in geospatial format in appendix 1 (Geospatial Data) and spreadsheet format in appendix 2 (Textural Analyses).
Seafloor Photography and Video
High-resolution digital photographs and standard-definition analog video of the seafloor were collected at all 301 locations within the study area (figs. 3 and 4). At each station, the USGS SEABOSS (fig. 5) was towed slightly above the sea floor at speeds of less than one knot. Because the recorded position is actually the position of the Global Postitioning System (GPS) antenna on the survey vessel, not the SEABOSS sampler, a conservative estimated horizontal accuracy of the sample location is ± 30 meters (m). Photographs were obtained using a Konica-Minolta DiMAGE A2 digital still camera, and continuous video was collected from a Kongsberg Simrad OE1365 high-resolution color video camera, usually for 5 to 15 minutes. Digital bottom photographs are available as JPEG images in appendix 3 (Bottom Photographs). Continuous video data are not included in this report but may be available upon request.
The photographs are geospatially located using a series of Python scripts that are run within an ArcGIS Toolbox. This process matches up the photographs with the survey navigation data based on a common date and time field. The result is a Geographic Information System (GIS) shapefile containing the photograph name, other important Exchangeable image file format (Exif) metadata extracted from the JPEG header as well as latitude and longitude for each photograph. The shapefile is also "hotlink-ready" for using in Esri ArcMap, enabling users to click on the photograph location on the map and view the photo.
Several of the attributes in the bottom photographs dataset were calculated in Esri ArcGIS using the Spatial Join tool. This tool was used to calculate the closest SEABOSS video survey trackline, the field number of the nearest surficial sediment sample, the sediment classification of the closest sample, and the distance in meters to the nearest sample for each bottom photo. Additional information about the processing steps can be found in the metadata for the bottom photographs dataset in appendix 1 (Geospatial Data).
|

