Open-File Report 20151057
Field Observations of Artificial Sand and Oil Agglomerates
 |
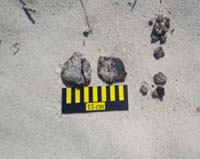
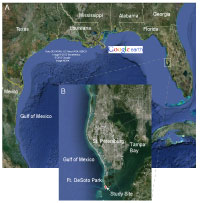
IntroductionDuring the Deepwater Horizon (DWH) oil spill, between April and June of 2010, several million barrels of gas and oil were released into the Gulf of Mexico (GoM), some of which was transported to the beaches and barrier islands offshore of Louisiana, Mississippi, Alabama, and Florida (McNutt and others, 2011; Michel and others, 2013; Reddy and others, 2012). Weathered oil that came ashore mixed with suspended sand in the surf zone to create heavier-than-water sand and oil agglomerates (SOAs) on the seafloor (Operational Science Advisory Team, 2014). These SOAs consist of between 70–90 percent sand and the remainder an oil and water mixture (Operational Science Advisory Team, 2011), and formed in the shape of mats a few centimeters (cm) thick and up to tens of meters (m) long as well as in smaller (1–10 cm) more mobile pieces, sometimes called surface residual balls (SRBs; fig. 1). With time, SOAs can be buried and exhumed, and pieces can break off of mats and be transported cross-shore or alongshore and result in beach re-oiling from months to years after the initial spill (Dalyander and others, 2014; Operational Science Advisory Team, 2014). Spilled oil clean-up efforts included searching for SOAs according to the Shoreline Cleanup and Assessment Technique (SCAT), a systematic and standardized approach for locating and identifying stranded oil that has been in practice since the Exxon Valdez spill (Michel and others, 2013). In this case, SCAT clean-up was overseen by the Unified Command responding to the DWH disaster. The SOAs found were removed when possible; in some areas, the threat that equipment and removal techniques posed to sensitive wildlife or habitats was deemed too large to allow removal. As part of the Operational Science Advisory Team (OSAT-3), the Federal On-Scene Coordinator (FOSC) commissioned experts, including staff from the USGS, to investigate the alongshore transport and seafloor interaction of SOAs in order to inform response operations. As a result, a scenario-based numerical modeling technique was developed to assess hydrodynamic conditions in the northern GoM (Long and others, 2014) and subsequent SOA response along the coasts of Alabama and Florida (Plant and others, 2013). Key findings include: larger (>2.5 cm) SOAs are not mobilized during typical lower-energy wave conditions, but may be mobilized during storm events; the greater mobility of sand compared to SOAs makes burial and exhumation likely; and inlets serve as traps for SOAs (Plant and others, 2013). Analysis of trends in SOA collection supported these findings (Dalyander and others, 2014); however, no direct observational data on the motion of SOAs on the seafloor were available. In order to fill the data gap, artificial sand and oil agglomerates (aSOAs) mimicking the physical characteristics (size, shape, density, sand composition) of genuine SOAs were constructed and deployed in the nearshore area at Fort Desoto Park, St. Petersburg, Florida (fig. 2). This location is along the GoM east coast, and therefore has a low-energy wave climate similar to the region of the northern GoM that was impacted by Deepwater Horizon. The primary goals of the experiment were to (1) attain direct observations of the physical dynamics of aSOAs in the nearshore environment; and (2) establish a dataset of aSOA observations that could later be used to assess and (or) develop sediment mobility and transport formulations to predict their response to hydrodynamic conditions. The construction of the aSOAs and the instrument set-up for the field campaign are described in the Methods section. The data processing and resulting formats are described in the Data Processing section. The ensuant data and observations, in the form of pressure data, derived water level elevation, and video and images of the aSOAs, are presented in the Data Catalog section. |

![]() U.S. Department of the Interior |
U.S. Geological Survey
U.S. Department of the Interior |
U.S. Geological Survey
URL: http://pubsdata.usgs.gov/pubs/of/2015/1057/ofr2015-1057_intro.html
Page Contact Information: GS Pubs Web Contact
Page Last Modified: Wednesday, 07-Dec-2016 21:42:27 EST