Open-File Report 20151057
Field Observations of Artificial Sand and Oil Agglomerates
 |
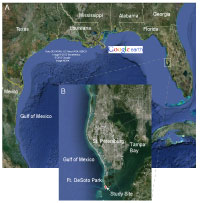
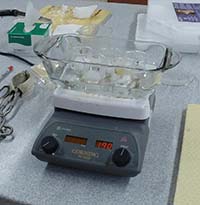
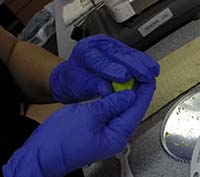
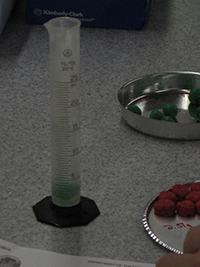
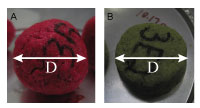
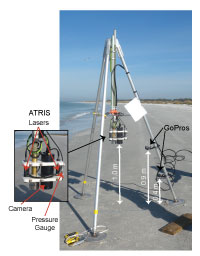
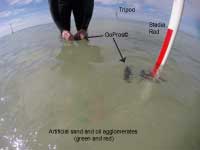
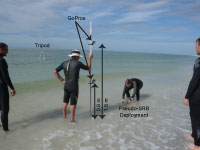
MethodsCreation and Characteristics of Artificial Sand and Oil AgglomeratesUsing genuine SOAs for experimental purposes would make it difficult to control their properties, particularly given that desiccation and other processes tend to make SOAs physically unstable (Hayworth and Clement, 2011) and would risk introduction of volatile material into the environment. For this reason, artificial sand and oil agglomerates (aSOAs) were constructed from quartz sand and paraffin wax. The goal of aSOA creation was to mimic the size and density—the two most important properties controlling a particles mobility (Shields, 1936; Soulsby, 1997)—of a genuine SOA. The aSOAs were created by melting paraffin wax in a hot water bath (fig. 3), then mixing in quartz sand from a local beach that had been sieved to remove particles larger than 710 micrometers (µm). Paraffin wax was chosen as a non-reactive binding agent due to its similar density (800 kilograms per cubic meter (kg/m3)) to weathered oil (~900 kg/m3). In addition, small amounts of brightly colored laboratory sand were mixed in to improve visibility on the seafloor. The mixtures were removed from the hot plate after they were stirred to promote homogeneity, and when they had cooled to a semi-solid (malleable) state they were physically formed into the desired size and shape (fig. 4). Through trial and error, it was determined that aSOAs consisting of more than approximately 80 percent sand (less than 20 percent paraffin) were not physically stable and tended to crumble (changing the size and mass). The theoretical concentration of aSOAs of this composition, based on a paraffin (sand) density of 800 kg/m3 (2650 kg/m3), is 1800 kg/m3. The actual density of individual aSOAs was calculated by using Archimedes principal to determine aSOA volume (fig. 5) and then weighing the aSOAs on a mass balance (table 1). The density of the aSOAs was slightly less than the density of genuine SOAs, which was calculated from observed values of composition to be 1750–2450 kg/m3 with a mean of 2107 kg/m3 (Plant and others, 2013). During the numerical modeling effort to investigate the mobility and alongshore transport of SOAs (Dalyander and others, 2014; Plant and others, 2013), a total of six size classes of SOAs (identified in the referenced publications as surface residual balls (SRBs)) were considered (table 2). All but the smallest size (0.03 cm diameter) were created resulting in 5 diameter-measured size classes of aSOAs (fig. 6): 0.5 cm, 1 cm, 2.5 cm, 5 cm, and 10 cm. Genuine SOAs tend to be patty-shaped, with an ellipsoidal profile when viewed from the side, whereas sediment mobility formulations were developed for spherical particles. Therefore, aSOAs of both shapes (spherical and ellipsoidal) were created. A three character identifier was used to denote individual aSOAs, with the first character indicating the size class (1–5), the second character indicating the particle shape (R for round or E for ellipsoidal), and the third character indicating the replicate number of the size/shape class. For large particles exposed above the seafloor, the critical stress may be less than for a similar particle in a uniform bed of the same sized particles. Critical stress values for each of the aSOAs was calculated using a high, medium, and low stress estimate appropriate for particles flush with, partially exposed, and fully exposed above the seafloor surface (table 1); see Dalyander and others (2014) and Plant and others (2013) for more details. Back to Top of PageField ExperimentThe aSOAs were deployed along the coast of Fort De Soto Park in Pinellas County, St. Petersburg, Florida (fig. 2). They were first deployed on the seafloor at a water depth of approximately 1.5 m, outside of the surf zone (table 3). A second set of deployments were conducted inside the surf zone (in about 0.5 m depth; table 4), and a third set in the swash zone. The swash zone deployments in particular were designed to qualitatively capture aSOA motion in a shallower environment than was considered in the previous numerical modeling effort (Plant and others, 2013). At the 1.5-m site, a tripod was equipped with the U.S. Geological Survey (USGS) Along-Track Reef Imaging System (ATRIS)(Lidz and Zawada, 2013; Zawada and others, 2008) with a 12.4 megapixel camera in a waterproof housing, a Keller America Microlevel pressure sensor sampling at 8 Hertz (Hz), and two guide lasers used to indicate the camera's imaging region on the seafloor (fig. 7). The ATRIS system sent images, taken at a rate of 20 frames per second, via cable to an onshore data acquisition system. The camera was mounted at 1 m above the seafloor and had a field of view of 0.29 m x 0.22 m with a frame size of 1360 x 1024 pixels (~46 pixels per centimeter (pixels/cm)). Images were saved in Joint Photographic Experts Group (JPEG) format, and each file has an associated text file containing the time stamp of the image. Also mounted to the tripod legs were two GoPro HERO3+ video cameras (www.gopro.com)(fig. 7). These cameras were deployed on the tripod because their fisheye lenses provided a greater field of view and would capture aSOA movement outside of the relatively limited field of view of the ATRIS. Raw images from the ATRIS system, the pressure data, and movies created for each deployment (see Data Processing) can be found on the Data Catalog page. However, the aSOAs did not move over long distances at the 1.5-m site and remained within the ATRIS field of view, therefore the GoPro camera's videos from that location are excluded from this report. At the 1.5-m site, we conducted seven deployments (table 3) to compare the variability of movement relative to size and shape under identical hydrodynamic and seafloor conditions. The first deployment contained a single, round aSOA from size classes 1–4; the round size 5 aSOA (10 cm in diameter, requiring a mold for creation) was not yet constructed at the time of the field experiment. The second deployment included one ellipsoidal aSOA from size classes 1–5. Because the largest aSOA appeared to block the flow to the smaller four, deployment three consisted of one ellipsoidal aSOA from class sizes 1–4. The final four deployments were designed to compare the variability in response of same-size aSOAs (particularly round vs. ellipsoidal), and each deployment consisted of multiple aSOAs of the same size but of both shapes. Because the round, size 5 aSOA was not available, there was no deployment with multiple 10-cm aSOAs. Occasionally, the location of the aSOAs was adjusted manually to increase the distance between individual particles. For the shallow water deployments in 0.5-m water depth, a GoPro camera was mounted to a stadia rod at 0.3 m, just beneath the water's surface (fig. 8). A field team member held the stadia rod still and upright. Two hand-held GoPro cameras provided additional video and images. Some of these images are included in this report; however, the video data from the hand-held cameras did not provide additional information and are not included in this report. The aSOAs were deployed on the seafloor alongshore and to the south, in view of the stadia-mounted GoPro camera. The camera was oriented in the direction of alongshore current and captured the alongshore transport away from the camera, in addition to any wave-induced, cross-shore transport. If the aSOAs appeared to move out of frame during the 1–2 minute deployments, they were either recovered and redeployed, or the stadia rod was rotated slightly. A set of 12 deployments were conducted (table 4), with 2 replicates each of: (1) round aSOAs from size classes 1–4; (2) ellipsoidal aSOAs from size classes 1–4; and (3–6) round and ellipsoidal aSOAs deployed by size class, duplicating the same combinations deployed at the 1.5-m site. The tripod ATRIS remained at the 1.5-m site in order to continue to record pressure data at a fixed position The aSOAs were more mobile in the swash zone than in the shallow surf zone, which, in combination with reduced visibility due to sediment suspension and surface foam, made recording their movement difficult. In these deployments, GoPro cameras were mounted to the stadia rod at heights of 1.8 m and 0.9 m (fig. 9) to capture the larger field of view required to observe the range of aSOA motion at these depths. A third handheld GoPro camera was also used. The stadia rod and mounted GoPro cameras were held upright and in a fixed position by a field team member, and the aSOAs were deployed in the swash zone in front of the stadia rod. Although multiple deployments were conducted to capture the unique combinations of aSOAs deployed at other sites, reduced visibility made smaller aSOAs impossible to identify in the videos. Therefore, data from only one deployment of size 3, 4, and 5 aSOAs (2.5-cm, 5-cm, and 10-cm diameter aSOAs) are included here, and consist of a video from the GoPro camera mounted to the stadia rod at a height of 0.9 m and the handheld GoPro camera. These videos provide qualitative information on aSOA movement in the swash zone. Back to Top of Page |

![]() U.S. Department of the Interior |
U.S. Geological Survey
U.S. Department of the Interior |
U.S. Geological Survey
URL: http://pubsdata.usgs.gov/pubs/of/2015/1057/ofr2015-1057_methods.html
Page Contact Information: GS Pubs Web Contact
Page Last Modified: Wednesday, 07-Dec-2016 21:42:28 EST