| Click on figures for larger images. |
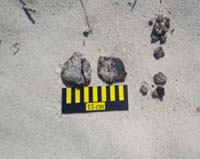 |
Figure 1. Sand and oil agglomerates, also known as surface residual balls, recovered in November 2011 along the Mississippi coast. |
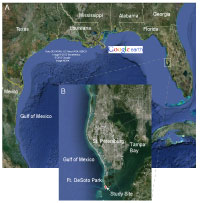 |
Figure 2. A, Map showing the Gulf of Mexico with B, the location of the artificial sand and oil agglomerate field deployment indicated. |
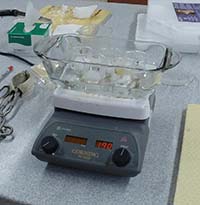 |
Figure 3. Hot water bath used for artificial sand and oil agglomerate creation. |
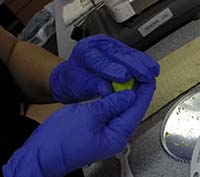 |
Figure 4. Manual shaping of artificial sand and oil agglomerates. |
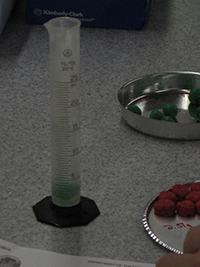 |
Figure 5. Determination of artificial sand and oil agglomerate density. |
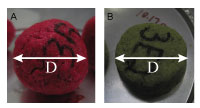 |
Figure 6. Size classification of artificial sand and oil agglomerates. |
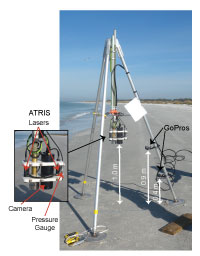 |
Figure 7. Instrumented tripod deployed in approximately 1.5-meter water depth. |
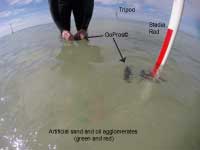 |
Figure 8. Shallow water deployment of artificial sand and oil agglomerates. |
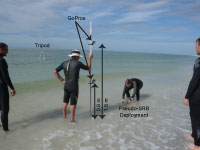 |
Figure 9. Swash zone deployment of artificial sand and oil agglomerates. |
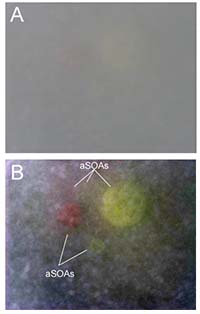 |
Figure 10. A, raw image taken with the Along-Track Reef Imaging System camera of one ellipsoid artificial sand and oil agglomerate of each of the five size classes; B, the same image, processed to increase the contrast and visibility by expanding over the range of intensities in the image. |


