Open-File Report 20151057
Field Observations of Artificial Sand and Oil Agglomerates
 |
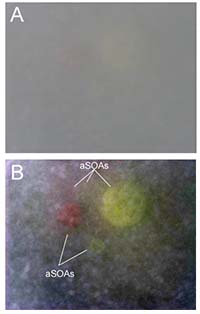
Data ProcessingWater Level Variation from Pressure DataThe ATRIS system returns pressure data in bars x 104. The distance between the sensor and the waters surface was calculated from this pressure at the experiment site latitude of 27°N using the CSIRO SeaWater Library (http://www.cmar.csiro.au/datacentre/ext_docs/seawater.htm). The 1-m distance between the sensor and the seafloor was then added to this value to attain the total water depth from seafloor to sea surface. The output values were saved in NetCDF format (http://www.unidata.ucar.edu/software/netcdf/) using the Mathworks Matlab NetCDF library (http://www.mathworks.com). To provide an indication of wave conditions, the mean of the water level (calculated from pressure data as described above) over the course of each deployment was removed prior to displaying the water-level time-series for that deployment below the images. These calculations removed the impacts of the tide and other potential low-frequency variations, resulting in a time-series of water level variation resulting from individual waves. Back to Top of PageImage Processing and Movie Creation: 1.5-meter Water Depth SiteImage processing and movie creation were done using the Mathworks Matlab software program (http://www.mathworks.com). Because of the limited light and the distance to the seafloor, aSOAs were difficult to identify within the images, with a low signal-to-noise ratio. Images were averaged over one second intervals in order to reduce the noise. To further increase the visibility of aSOAs, the intensity of each color stream (red, green, blue) in the averaged image was expanded over the range of individual color intensities within that image (for example, if the range of intensities within the image was 100 to 150, the image was expanded so 100 corresponded to 0 and 150 corresponded to 255, thus enhancing the contrast) (fig. 10). A scale bar was added to the image based on the field of view of the ATRIS. Back to Top of PageImage Processing and Movie Creation: 0.5-meter Water Depth SiteA GoPro video camera provided video footage of aSOAs at this deployment location at a rate of ~30 frames per second. Individual frames were loaded into Matlab and processed as described for the ATRIS images. The aSOAs were relatively visible in these images compared to the 1.5-m site due to the camera being positioned closer to the aSOAs and the increased light intensity at shallower depth. For this reason, and because aSOAs were relatively mobile at these depths, frames were individually processed without averaging. Because of the oblique angle of the images and the fisheye lens of the GoPro camera, it was not possible to add a scale bar based on field of view. Instead, the widths of the aSOAs themselves were used to insert a scale bar. For multiple images containing the 10 cm and 5 cm aSOAs, the number of pixels per centimeter was determined, averaged, and used to insert an approximate scale bar. Because the pressure data from which water level was derived came from the ATRIS and the video imagery in this case came from a GoPro camera, there was a slight offset in the time that needed to be corrected to properly identify the point in the water level time-series at which the image was taken. At the start of the field experiment, pictures of a handheld device synced to an atomic clock were taken with each camera system. The offset between each system and the atomic clock was used to determine the offset between the GoPro camera and ATRIS system, and was found to be 39 seconds. The offset was confirmed by comparing the time stamps of discernable unique events (such as aSOA placement) at the 1.5-m site where the GoPro camera and ATRIS captured images of the same event. Back to Top of PageMovie Creation: Swash Zone SiteBecause videos of the swash deployments were taken with the camera above the water surface, foam, bubbles, and other white (color saturated) objects enhanced the contrast of the images and degraded aSOA visibility. Therefore, the images were not processed nor were water level data added to the videos as was done for the other sites. Instead, videos were truncated in time to the range of the single deployment included with this report (a deployment of ≥2.5 cm aSOAs) and cropped to the spatial region of interest in the frames. This minimal processing was done using Avidemux v.2.6.8 (http://avidemux.sourceforge.net/). Back to Top of Page |

![]() U.S. Department of the Interior |
U.S. Geological Survey
U.S. Department of the Interior |
U.S. Geological Survey
URL: http://pubsdata.usgs.gov/pubs/of/2015/1057/ofr2015-1057_process_data.html
Page Contact Information: GS Pubs Web Contact
Page Last Modified: Wednesday, 07-Dec-2016 21:42:29 EST