U.S. Geological Survey Open-File Report 2015-1153
![]() / Title Page / List of Figures / Conversion Factors / Abbreviations / Abstract / Introduction / Methods / Results / Discussion / Summary / Acknowledgments / References Cited / Appendix — Geospatial Data / Citation Page /
/ Title Page / List of Figures / Conversion Factors / Abbreviations / Abstract / Introduction / Methods / Results / Discussion / Summary / Acknowledgments / References Cited / Appendix — Geospatial Data / Citation Page /
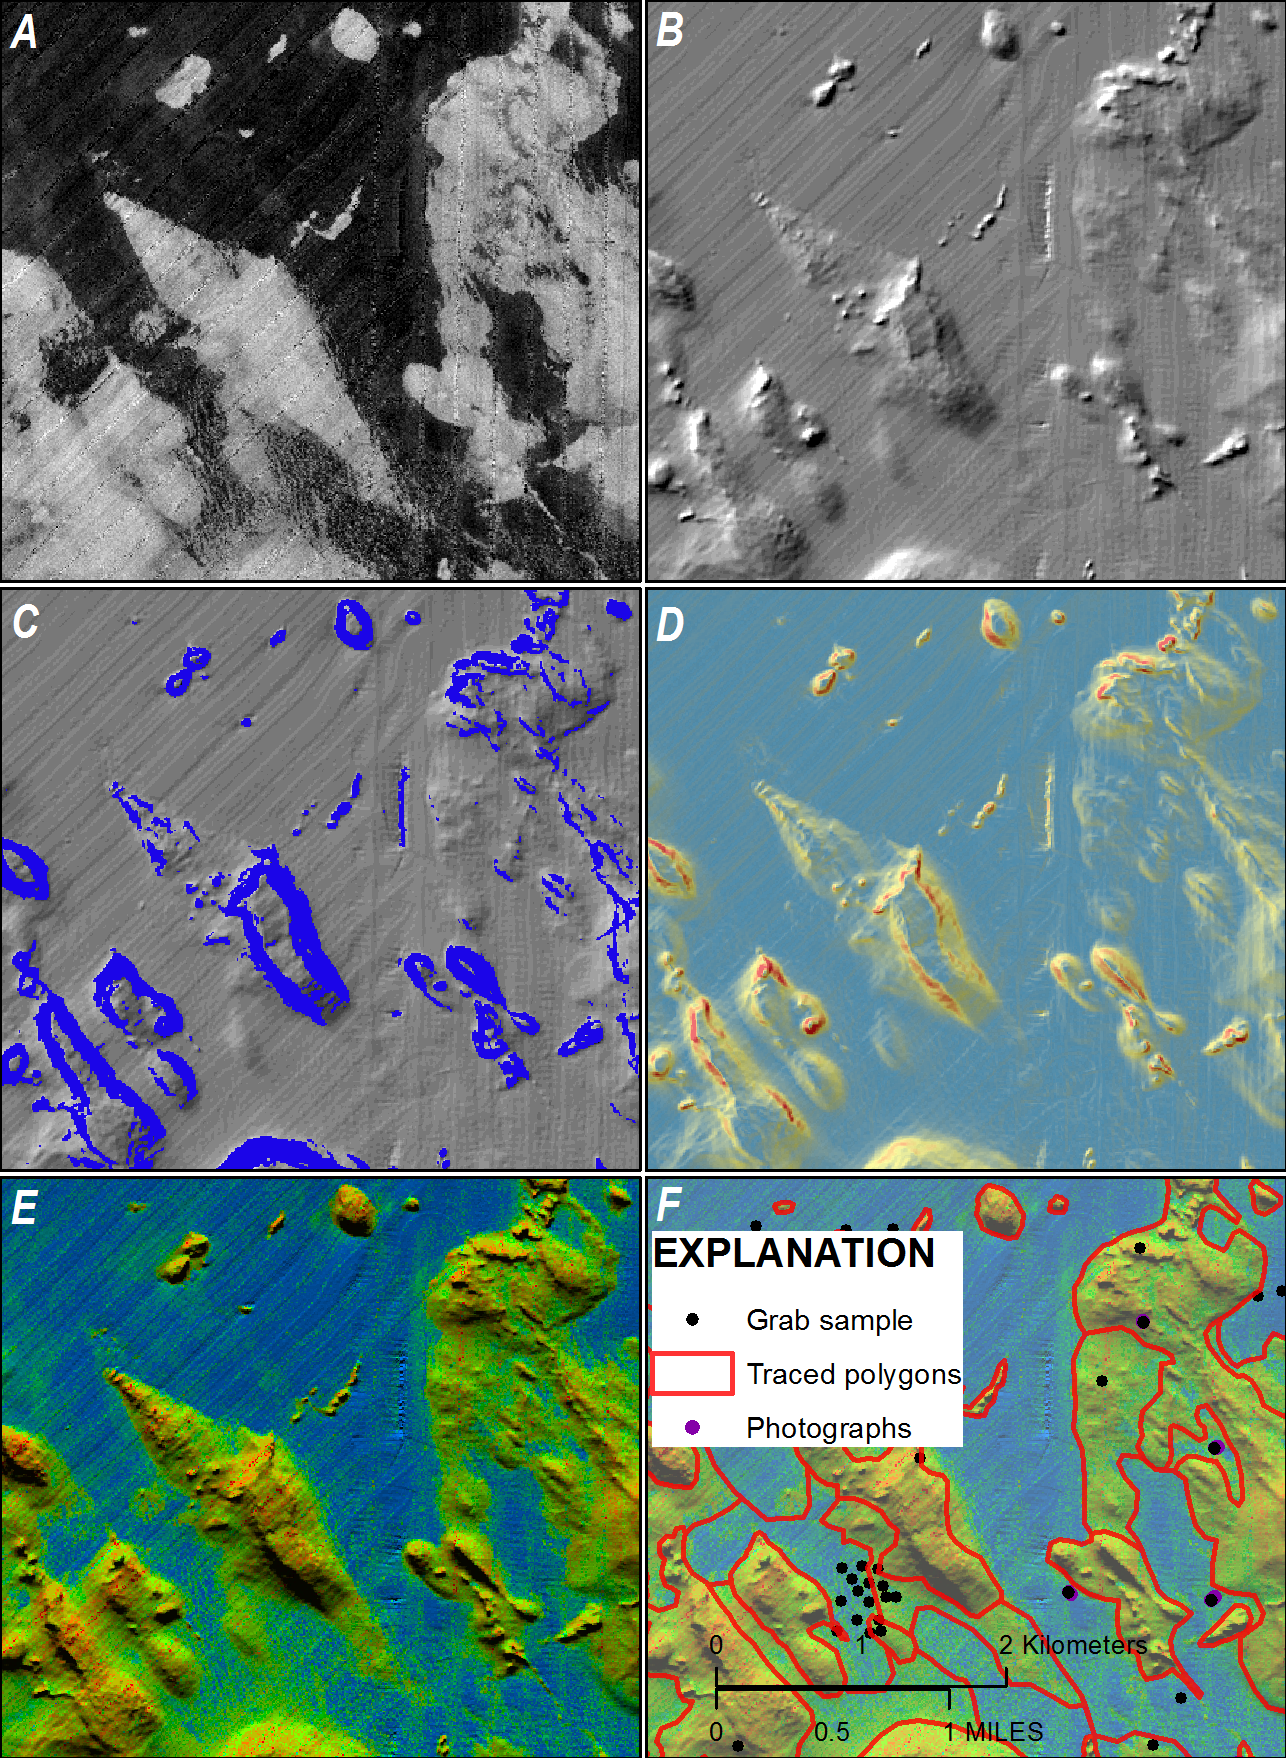
Figure 9. Sediment texture polygons were created in ArcGIS by using A, backscatter data, where areas of high backscatter intensity (light tones) have strong acoustic reflections and suggest boulders, gravels, and generally coarse sea-floor sediments ,and areas of low backscatter intensity (dark tones) have weak acoustic reflections and generally are characterized by fine-grained material such as muds and fine sands; B, hillshaded relief imagery, which creates a three-dimensional effect to provide a sense of topographic relief; C, rugosity, where blue polygons outline areas of variation or frequent amplitude changes in topography, often referred to as surface roughness; D, slope, where warm colors represent steeper areas of the map and cool colors represent flatter areas; and E, pseudocolored multibeam backscatter intensity(Butman and others, 2007), which combines backscatter and hillshaded relief. Each data type can provide useful information in a given area when defining texture boundaries. F, Bottom samples and photographs are used to assign a sediment texture within each polygon drawn on the basis of geophysical data and derivatives such as B–E.

![]() U.S. Department of the Interior |
U.S. Geological Survey
U.S. Department of the Interior |
U.S. Geological Survey
URL: http://pubsdata.usgs.gov/pubs/of/2015/1153/figurepages/ofr20151153_fig9.html
Page Contact Information: GS Pubs Web Contact
Page Last Modified: Wednesday, 07-Dec-2016 21:45:15 EST
