U.S. Geological Survey Open-File Report 2015-1153
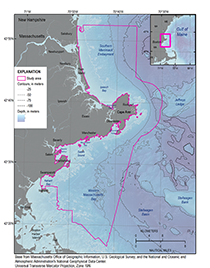
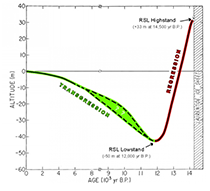
IntroductionPurpose and ScopeThis report describes sea-floor texture and distribution and physiographic zones of the Massachusetts coastal zone between Salisbury and Nahant, Massachusetts, including the southern Merrimack Embayment and western Massachusetts Bay (fig. 1). This report supplements and expands interpretations in the nearshore zone of Nahant to Gloucester, Mass. (Barnhardt and others, 2006), and the southern Merrimack Embayment (Barnhardt and others, 2009; Hein and others, 2013). Interpretations are provided as geospatial data layers in Esri Inc. ArcGIS formats (appendix 1). This research was part of a cooperative sea-floor mapping program (http://woodshole.er.usgs.gov/project-pages/coastal_mass/) between the U.S. Geological Survey and the Massachusetts Office of Coastal Zone Management (CZM). This cooperative effort fosters data collection and the production of interpretive geospatial datasets that can be used by managers and scientists to delineate marine resources, assess environmental change, inventory marine habitats, and support research concerning sea-level change, sediment supply, and coastal evolution (Massachusetts Office of Coastal Zone Management, [2015]). The maps presented in this report are based on interpretation of high-resolution seismic-reflection data, swath bathymetry, acoustic backscatter, bottom photographs, and sediment samples collected within nearshore regions (less than about 30-meter [m] water depth) from Nahant to Salisbury (Barnhardt and others 2006, 2009); lidar observations in water less than approximately 3 m deep (Joint Airborne Lidar Bathymetry Technical Center of Expertise and U.S. Army Corps of Engineers, 2008); bottom photographs and texture data (Gutierrez and others, 2000) and multibeam and backscatter data collected around Cape Ann and western Massachusetts Bay in water depths greater than 30 m (Butman and others, 2007); and sediment texture databases (Ford and Voss, 2010; McMullen and others, 2011) modified by the CZM (Emily Huntley, CZM, unpub. data, 2012). These data were used to create a statewide sediment texture distribution map and physiographic zone dataset wherever high-resolution geophysical data exist. This report extends the previous nearshore interpretations of physiographic zones to the State offshore boundary (approximately 3 miles) and presents a new sea-floor sediment texture map for the Massachusetts coastal zone from Nahant to Salisbury, including western Massachusetts Bay and the southern Merrimack Embayment. Geologic SettingThe coastal zone from Nahant to Salisbury consists of three distinct geomorphic segments. The first coastal segment, which extends northeast from Nahant to Gloucester (fig. 1) is characterized by numerous rocky headlands and islands, small pocket beaches, and narrow harbors. The second coastal segment encompasses the entire Cape Ann promontory from Gloucester to the Annisquam Harbor and separates the southern Merrimack Embayment from Massachusetts Bay. The third coastal segment extends from Annisquam Harbor to the New Hampshire border and consists of a chain of sandy barrier islands separated by tidal inlets. Granitic bedrock near Nahant is primarily Precambrian, but farther north at Cape Ann, granites are generally Ordovician to Devonian (Cameron and Naylor, 1976; Zen and others, 1983). Offshore, bedrock from Hull to Salisbury is locally overlain by Triassic sedimentary units or Cretaceous- and Tertiary-age coastal plain deposits (Oldale and others, 1983). Pleistocene glacial deposits and Holocene postglacial beach and marsh deposits unconformably overlie pre-Quaternary age units. Bedrock exposures are uncommon along the coast and on the inner shelf between Annisquam Harbor and Salisbury (Oldale and Wommack, 1987; Hein and others, 2013). The Quaternary geology of this region has been the subject of several geologic investigations (table 1). The complex surficial geology is attributed to the occupation and retreat of glacial ice sheets during the Pleistocene and subsequent sea-level change during the Holocene (Larson, 1982; Stone and Borns, 1986; Oldale and others, 1993). Most of the glacial sediments overlying bedrock and coastal plain material were deposited by the Wisconsinan Laurentide ice sheet (Oldale and Bick, 1987; Oldale and Wommack, 1987), which reached its maximum extent in eastern Massachusetts at present-day Martha’s Vineyard and Nantucket about 20,000 to 24,000 years before present (BP; Uchupi and others, 1996; Oldale, 2001; Boothroyd and Sirkin, 2002). Sea-level rise was concurrent with ice-front retreat, which resulted in widespread deposition of glaciomarine sediments (Stone and Peper, 1982; Oldale and Bick, 1987; Oldale, 1988). After the glaciers retreated north of Boston, Mass., about 14,500 years BP, relative sea-level change became the dominant factor driving coastal evolution (Oldale and others, 1993). Between about 14,000 and 12,000 years BP, relative sea level fell rapidly as the region rebounded from ice removal, subaerially exposing and deeply incising the inner continental shelf with meltwater drainage systems (Oldale and Bick, 1987; Oldale and Wommack, 1987; Oldale and others, 1993). Eustatic sea-level rise outpaced waning isostatic rebound about 12,000 years BP, causing the onset of the Holocene marine transgression that continues today (fig. 2; Oldale and others, 1993). Valleys incised on the inner shelf during the regression were partially filled by fluvial and estuarine deposits as sea level rose and oceanographic processes eroded, reworked, and redistributed sediments across the inner shelf seaward of the transgressing shoreline. Inner continental shelf sediments in water depths less than about 40 m south of Cape Ann have been extensively eroded and reworked during the Holocene marine transgression and by modern oceanographic processes (Knebel and Circe, 1995; Butman and others, 2006, 2008; Warner and others, 2008), resulting in coarse sea-floor textures characterized by winnowed glacial and lag deposits and outcropping pre-Quaternary age deposits. Rocky pavements consisting of boulders, cobbles, and gravel mixed with sand are extensive and interspersed with narrow channels and valleys filled with sand, gravel, and some mud (Knebel and Circe, 1995; Oldale and Bick, 1987). Erosion of glacial sediments on the inner continental shelf has provided sand and gravel for small pocket beaches, but the shoreline is largely bedrock framed. The inner continental shelf surrounding Cape Ann consists of high-relief bedrock exposures to water depths of 20 to 30 m, but sea-floor composition in deeper water to the north and south abruptly transitions to sand and muddy sands, respectively. Farther north of Cape Ann, sand is abundant along the shoreline and on the inner shelf. Sand and gravel deposited in the Merrimack paleodelta during sea-level lowstand (fig. 2) were reworked and distributed on the shelf during Holocene marine transgression (Oldale and others, 1983; Edwards, 1988; Barnhardt and others, 2009; Hein and others, 2013). Together, the modern Merrimack fluvial sediments and erosion and redistribution of the lowstand delta deposits on the inner continental shelf are responsible for creating the longest barrier island chain in the Gulf of Maine (FitzGerald and others, 1994). Previous WorkSurficial sediment distribution within the coastal zone of Massachusetts is complex and difficult to map because of frequent substrate changes in this glaciated region that occur over small spatial scales (tens of meters). A number of studies have discussed the geology, geologic evolution, sediment distribution, and sea-level history of the southern Merrimack Embayment and western Massachusetts Bay (table 1). Early descriptions of the sea-floor texture in this region were based on widely spaced geophysical tracklines and (or) samples (Schlee and others, 1973; Folger and others, 1975; Oldale and Bick, 1987; Oldale and Wommack, 1987; Knebel and Circe, 1995; Ford and Voss, 2010). Recent studies using higher data density and swath mapping technology (Butman and others, 2003a-c; 2004; Barnhardt and others, 2006, 2009; Hein and others, 2013) build upon earlier regional investigations conducted in Massachusetts Bay (Oldale and Bick, 1987) and the southern Merrimack Embayment (Oldale and Wommack, 1987). Barnhardt and others (2006) used a multivariate analysis approach to broadly define sea-floor texture into three main classes, which are sand and silt, cobble and boulder, and ledge. Although this classification is based on the same high-resolution geophysical data used by Barnhardt and others (2009) and Hein and others (2013) and used automated classification techniques, it has less application for resource management and habitat studies than a more supervised mapping technique because of the small number of texture classes and the difficulty in accurately classifying acoustic data with automated techniques (artifacts present in the data such as noise in the water column and nadir influence the accuracy of the classification).
Table 1. Previously published studies of sea-floor geology in the southern Merrimack Embayment and western Massachusetts Bay.
|
|

![]() U.S. Department of the Interior |
U.S. Geological Survey
U.S. Department of the Interior |
U.S. Geological Survey
URL: http://pubsdata.usgs.gov/pubs/of/2015/1153/html/ofr20151153_introduction.html
Page Contact Information: GS Pubs Web Contact
Page Last Modified: Wednesday, 07-Dec-2016 21:45:29 EST