U.S. Geological Survey Open-File Report 2015-1153
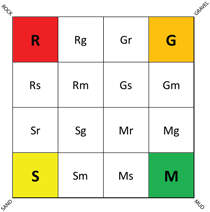
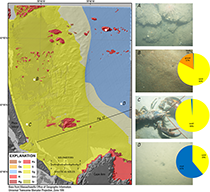
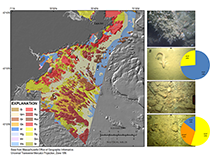
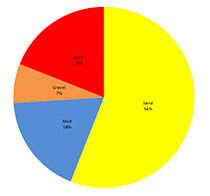
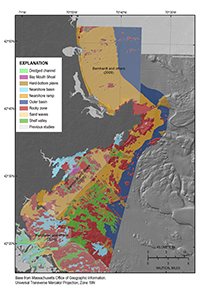
ResultsSediment Texture and DistributionSediment texture and distribution were mapped for more than 1,043 square kilometers (km2; fig. 11) by using the Barnhardt and others (1998) classification (fig. 8). The data were interpreted at a scale ranging from 1:8,000 to 1:25,000, depending on the resolution of the source geophysical grids and the sample data density. Sediments within the study area represent nearly all particle sizes. Sediment texture ranges from muddy sediments offshore and in semiprotected settings along the coast to pebbles, cobbles, and boulders where drumlins, till, lag deposits, and bedrock are exposed at the sea floor (figs. 11, 12, and 13). Both coarse- and fine-grained sediment exist in all water depths; however, in general, fine-grained sediments are in the deeper water (greater than about 50 m), and rocky textures are more prevalent along the nearshore margins of the bedrock-framed coastline and in western Massachusetts Bay (figs. 11 and 13). Rocky textures are least concentrated north of Cape Ann in the southern Merrimack Embayment (figs. 11 and 12). A mean sorting value of 1.6 suggests that the sediment is poorly sorted in the entire region, which is consistent with a reworked glacial environment. Overall, the samples in the texture database for the study area are 62 percent sand, 33 percent mud, and 5 percent gravel by weight. Sand (greater than 0.062 mm to 2 mm) is the dominant bottom sediment type within the study area and is interpreted to cover 53 percent of the sea floor by area (fig. 11). Sand is most extensive north of Cape Ann. Muddy sediments, which include silt- and clay-size particles less than 0.062 mm in diameter, cover about 17.5 percent of the sea floor by area (fig. 14). Samples with the highest mud percentages were primarily collected in water depth greater than 60 m. Sediments from around Cape Ann and to the south are highly variable in terms of mud content, ranging from 0 percent to 92 percent mud with an average of 26 percent in water depths less than 60 m. However, north of Cape Ann mud content is low, ranging from 0 to 40 percent with an average of less than 4 percent in water depths less than 60 m (fig. 12). Gravel or particles greater than 2 mm but less than 64 mm (-1 to -6 phi) in diameter are interpreted to be the primary sediment cover for 7.5 percent of the sea floor. Many photographs document the occurrence of gravel and cobble in rocky areas where sediment samplers were unable to recover large-diameter particles, suggesting that gravel and rock are underrepresented in sediment sample data in this area. Primarily rocky areas are interpreted to cover about 22 percent of the sea floor by area and are most prevalent adjacent to rocky headlands along the coast or associated with reworked glacial deposits in western Massachusetts Bay (figs. 11 and 13). Physiographic ZonesThe areal distribution of physiographic zones in the offshore portion of the study area (517 km2) was interpreted at a scale ranging from 1:8,000 to 1:25,000, depending on the resolution of the source geophysical grids. Physiographic zone interpretations of Barnhardt and others (2006, 2009) and Pendleton and others (2013) are shown adjacent to the physiographic zones identified in this study (fig. 15). Rocky zones are rugged areas of high bathymetric relief, ranging from nearly vertical rock cliffs to relatively flat, gravel-covered plains with boulders several meters in diameter. Although coarse-grained sediments locally occur in all physiographic zones, they dominate the sea floor in rocky zones. Rocky zones are extensive in the nearshore from Nahant to Gloucester (37 percent of the sea floor by area; Barnhardt and others, 2006), adjacent to Cape Ann, and throughout western Massachusetts Bay (33 percent of the sea floor by area; fig. 15), but are relatively sparse north of Cape Ann (5 percent of the sea floor by area; Barnhardt and others, 2009). Outer basins are associated with the seaward extent of the inner continental shelf. They are generally found in water depths greater than 40 m and are typically of a finer texture than shallower water sediments but may contain occasional rock outcrops. Outer basins are the third most common physiographic zone in area of western Massachusetts Bay in the study, making up 20 percent of the sea floor. Barnhardt and others (2006) found no outer basins in the nearshore area from Nahant to Gloucester (likely due to the shallow water depths within the survey area), and roughly 27 percent of the sea floor north of Cape Ann is classified as outer basin (Barnhardt and others, 2009). Sediment samples within the outer basins range from sand to muddy sediments. Outer basins are locally interrupted by outcrops of pre-Quaternary age coastal plain sediments, Paleozoic bedrock, and coarse-grained glacial deposits classified as rocky zones or hard-bottom plains (till and drumlins; Hein and others, 2013; Oldale and Wommack, 1987). Nearshore basins are areas of shallow, low-relief sea floor adjacent to the mainland, which are separated from offshore areas by islands or shoals. Nearshore basins make up less than four percent of the sea floor by area (fig. 15; Barnhardt and others 2006, 2009) and are found primarily north and east of Marblehead, Mass., adjacent to rocky headlands. Surficial sediment samples within nearshore basins indicate that these zones are filled with rock and gravel to muddy sediments and their composition is related to that of adjacent features, such that fine-grained nearshore basins (muddy with locally coarse sediment) occur near fine-grained areas like Gloucester Harbor, Manchester Bay, and Salem Sound (Barnhardt and others, 2006), whereas coarse-grained nearshore basins (sandy to gravelly sediments) are within Boston’s outer harbor (Pendleton and others, 2013) and western Massachusetts Bay. Ebb-tidal deltas and bay mouth shoals are only present within areas interpreted by Barnhardt and others (2006, 2009) and are not discussed here as part of the interpretation of western Massachusetts Bay and the southern Merrimack embayment. Combined ebb-tidal deltas and bay mouth shoals comprise just more than 1 percent of the sea floor within the study area (Barnhardt and others, 2006, 2009). Hard-bottom plains tend to have low bathymetric relief, with a coarse sediment texture consisting of primarily gravel, sand, and rock. Hard-bottom plains account for about 4 percent of the sea floor within the study area and are concentrated in western Massachusetts Bay in intermediate water depths (15–30 m) and are likely associated with lag deposits (fig. 15). There are no hard-bottom plains identified north of Cape Ann (Barnhardt and others, 2009). Nearshore ramps are areas of gently sloping sea floor with generally shore-parallel bathymetric contours. These zones are primarily covered with sand-rich sediment, although small exposures of cobbles and boulders locally crop out on the sea floor. Nearshore ramps are the primary physiographic zone north of Cape Ann (64 percent of the sea floor by area; Barnhardt and others, 2009) and from Nahant to Gloucester (40 percent of the sea floor by area; Barnhardt and others, 2006). In the physiographic zones presented in this report, however, nearshore ramps account for less than 20 percent of the sea floor by area, which is likely due to the significant offshore area included in the report (fig. 15). Shelf valleys are elongate depressions that extend offshore, often perpendicular to the trend of the coastline, and slope gently seaward. Shelf valleys represent about 15 percent of the study area but are somewhat less prevalent in the more nearshore study areas presented by Barnhardt and others (2006, 2009; fig. 15). These zones are interpreted to have formed by fluvial erosion during periods of lower-than-present sea level and are most commonly dominated by sandy textures.
|
|

![]() U.S. Department of the Interior |
U.S. Geological Survey
U.S. Department of the Interior |
U.S. Geological Survey
URL: http://pubsdata.usgs.gov/pubs/of/2015/1153/html/ofr20151153_results.html
Page Contact Information: GS Pubs Web Contact
Page Last Modified: Wednesday, 07-Dec-2016 21:45:32 EST