U.S. Geological Survey Open-File Report 2015-1153

|
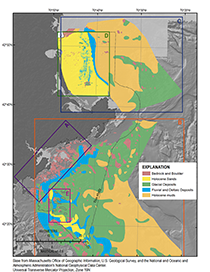
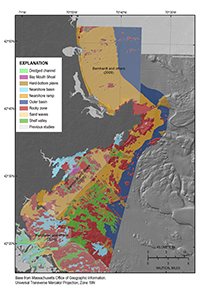
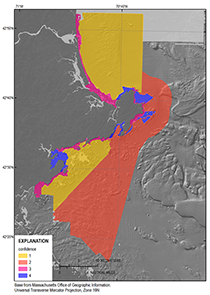
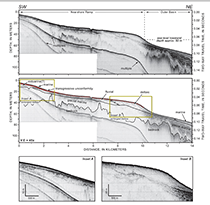
DiscussionComplete coverage of the sea floor with geophysical data at a spatial resolution of 2 to 10 m provides a previously unavailable means of interpreting the sea-floor. The following section outlines our confidence in the interpretations and some of their limitations, and it indicates how these data are combined to create a high-resolution, in-depth view of the sea-floor environment in the region. Confidence and Limitation in InterpretationsBecause all data input sources were not available in all parts of the study area, qualitatively defined polygons of sediment texture were assigned a data interpretation confidence value between 1 and 4 based on the quality and number of data sources available (fig. 16). Sediment texture regions that were defined on the basis of the highest resolution bathymetry (5 m) and backscatter (1 m), bottom photographs, sediment samples, and seismic interpretations (Barnhardt and others 2006, 2009) were given the highest data interpretation confidence value of 1. Areas with a confidence value of 1 (very high confidence) include areas in the Nahant to Gloucester and Cape Ann to Salisbury studies published by Barnhardt and others (2006, 2009). A confidence value of 2 (high confidence) was given to areas with multibeam bathymetry and backscatter data of 10-m resolution and sediment samples and bottom photographs (Butman and others, 2007; Gutierrez and others, 2000), but only sparse-density seismic interpretations with regional-scale geologic maps were available (Odale and Bick, 1987; Oldale and Wommack, 1987; Oldale and others, 1994). The high-confidence (2) area is primarily offshore, east from Cape Ann to the southern extent of the study area, generally in water depths greater than 10–20 m. Moderate-confidence values (3) were assigned to nearshore areas (typically shallower than 5 m), where only lidar data of 2.5-m resolution, aerial photography, and sediment samples were available. Low-confidence values (4) are generally assigned to small areas of sea floor where lidar data were not collected or areas too shallow and rocky to navigate by boat. Interpretations in these relatively small (on average less than 1 km2) low-confidence areas were made from aerial photographs, sediment samples, and extrapolation from adjacent areas of higher confidence. The qualitative interpretations are limited because the resolutions of the source geophysical data and the spacing of sediment samples do not capture all variations in sea-floor texture. The data were interpreted at scales between 1:8,000 and 1:25,000, but the recommended scale for application of the results is greater than 1:25,000. In general, features below 5,000 square meters or less than 50 m wide were not digitized because of positional uncertainty, lack of sample information, and the often ephemeral nature of small-scale sea-floor features (for example, bedforms). Not all digitized sea-floor features contained sample or photographic information; therefore, sea-floor texture is sometimes determined on the basis of the nearest similar feature that contains a sample. Conversely, sometimes a digitized feature contained multiple samples that were not all of the same texture. In these cases, the texture within the polygon was defined by the dominant sediment texture (based on Barnhardt and others, 1998) or mean phi size, when available. Ground truth data in rocky areas often are limited to bottom photographs because the sampling devices are not physically designed to collect cobbles or boulders. Sediment texture interpretation based on bottom photograph classification is subjective, such that the dominant sediment type within the view frame is an estimate determined by the interpreter and may differ among interpreters. Furthermore, particle size cannot be accurately determined in bottom photographs; the division between gravel and rock (64 mm) as perceived in bottom photographs is an approximation. Bottom photograph transects often reveal changes in the sea floor over distances of less than 100 m, and these changes are often not captured in acoustic data. Sea-floor texture in reworked glacial environments can change over short distances (meters), and many small-scale changes will not be detectable or mappable at a scale of 1:25,000. The boundaries of polygons are often inferred on the basis of sediment samples, and even boundaries that are traced on the basis of backscatter intensity or rugosity changes in geophysical data are subject to migration and positional uncertainty. Polygon boundaries should be considered an approximation of the location of a change in texture. Sediment ClassificationThe Barnhardt and others (1998) classification was chosen as the most representative classification scheme for defining sea-floor texture for this study area because of the complex nature and heterogeneity of sea-floor material and the scale at which these data are mapped. This system works well for inner shelf environments where one sediment unit is generally inadequate for representing sea-floor texture, such as the New England coast, where reworked tills and rocky pavements are common. Linking the InterpretationsSurficial geologic units of Oldale and Bick (1987), Oldale and Wommack (1987), Oldale and others (1994), Hein and others (2013), and Barnhardt and others (2006, 2009) can be linked to the areal distribution of surficial sediment distribution and physiographic zones presented here (figs. 5, 11, and 15). Bedrock outcrops are most extensive along the nearshore of western Massachusetts Bay and Cape Ann and account for roughly 9 percent of the interpreted sea floor by area (fig. 5). Bedrock outcrops correspond to rocky zones and hard-bottom plains, where the most common sediment textures are R, Rs, Rg, and less often Gr. Wisconsinan- and earlier Pleistocene-age glacial sediments crop out throughout western Massachusetts Bay and are sparse north of Cape Ann. Pleistocene glacial units interpreted by Oldale and Bick (1987), Oldale and Wommack (1987), Oldale and others (1994), and Hein and others (2013), comprise roughly 30 percent of the sea floor within interpreted areas and are most often associated with dominant surficial sediment textures R, G, and S. Glacial deposits include all sediment types, but they are largely winnowed on the inner shelf in western Massachusetts Bay and include gravel and rock pavements, lag deposits, and topographic highs interpreted to be drowned drumlins (Oldale and others, 1994). Glacial sediments cropping out on the inner shelf north of Cape Ann are identified by Hein and others (2013) as drumlins and are likely Illinoian in age (Newman and others, 1990). Glacial deposits in western Massachusetts Bay are more extensive than in the southern Merrimack Embayment and are described by Oldale and Bick (1987) as glacial-marine deposits that can include subaqueous stratified ice-contact material, outwash, till, and drift. Oldale and others (1994) identified a submerged drumlin field within the study area thought to be cored by till of Illinoian age (fig. 5). Lowstand deposits including late Pleistocene to early Holocene age fluvial, estuarine, and deltaic sediments (Oldale and others, 1983; Oldale and Wommack, 1987; Hein and others, 2013) cover approximately 10 percent of the sea floor in the interpreted area (fig. 5). A lowstand delta in the southern Merrimack embayment was first described by Oldale and others (1983). The majority of the paleodelta surface, foresets, and fluvial and estuarine network has been truncated, reworked, and subsequently buried (fig. 17; Oldale and others, 1983). The abundance of sand on the inner shelf and within the barrier island system of the southern Merrimack Embayment is attributed to the erosion of fluvial and deltaic sediments from the drowned Merrimack River Delta and the subsequent redeposition of these sediments through transgressive marine processes (FitzGerald and others, 1993). Samples from sites where the delta sediments are thought to be exposed at the sea floor contain on average 77 percent sand, 8 percent gravel, and 15 percent mud. The seaward extent of the paleodelta marks the transition from outer basin to nearshore ramp in the physiographic zone interpretation of Barnhardt and others (2009). South of Cape Ann, fluvial and estuarine deposits are concentrated in water depths less than 50 m, or roughly the extent of the shoreline at the sea-level lowstand (Oldale and Bick, 1987). The geologic interpretation of Oldale and Bick (1987) did not extend onshore beyond the 30-m contour, but it is likely that the fluvial and estuarine deposits interpreted at the landward extent of the study continued onshore between bedrock outcrops interpreted by Barnhardt and others (2006; fig. 18) and were eroded and reworked during the Holocene marine transgression. The average sand content within interpreted fluvial and estuarine deposits in western Massachusetts Bay is 91 percent sand, with 4 and 5 percent gravel and mud, respectively. Fluvial and estuarine deposits are most often associated with shelf valleys and nearshore ramp physiographic zones in western Massachusetts Bay. Holocene-age sandy units or modern beach and bar deposits as described by Oldale and Bick (1987) and Oldale and Wommack (1987) are abundant in the southern Merrimack Embayment. A Holocene sand sheet covers nearly 65 percent of the inner shelf north of Cape Ann and is on average 90 percent sand with 7 and 3 percent gravel and mud, respectively. South of Cape Ann, Holocene sand units are small and sparse, only about 6 percent of the area interpreted by Oldale and Bick (1987). Holocene sand accumulations in western Massachusetts Bay were derived from the erosion of generally poorly sorted glacial deposits, which yielded much less sand to the inner continental shelf and shoreline during the marine transgression when compared to the Merrimack paleodelta north of Cape Ann. Holocene sands are most commonly associated with nearshore ramp physiographic zones throughout the study area. Holocene muds or Holocene marine deposits are primarily seaward of the 50-m isobath within the study area. North of Jeffreys Ledge, areas interpreted as Holocene muds are composed of 60 percent mud and 30 percent sand. From Jeffreys Ledge to the south, sand and mud contents are slightly less (58 and 36 percent, respectively) because of slightly higher average gravel content (6 percent). Holocene muds are most closely correlated with the location of outer-basin physiographic zones. Coastal Evolution and Modern Processes on the Inner Continental ShelfThe comparison between the spatial distributions of outcropping geologic units and sea-floor sediment textures provides insight to sea-floor composition and the physical processes that have affected regional sediment texture patterns (figs. 5, 11, and 15). Massachusetts Bay is largely a reworked Pleistocene surface (fig. 5). The coarsest textures (Rg, Rs, and Gr) are most prevalent within western Massachusetts Bay, where bedrock outcrops and reworked and winnowed glacial deposits are expansive. Textures generally become fine offshore as depth increases into Stellwagen Basin; the sea floor transitions from bedrock along the coast (Barnhardt and others, 2006) to local outcrops of bedrock interspersed within winnowed glacial and fluvial deposits, and then to fine-grained marine deposits in water depths greater than 50 m. This pattern of coarse sediment textures nearshore in western Massachusetts Bay and fining offshore is consistent with storm-driven sediment transport studies conducted by Warner and others (2008). The largest wave-driven bottom stresses in this region are associated with northeastern storms (Butman and others, 2008). Numerical simulations of sediment transport in Massachusetts Bay during these storms show that storm-generated waves and currents resuspend and transport nearshore sediment to the south into Cape Cod Bay and offshore toward Stellwagen Bank. Large-amplitude internal waves, generated by tidal flow across Stellwagen Bank in summer, also winnow and transport fine-grained sediments from the western shore of Massachusetts Bay offshore toward Stellwagen Basin (Butman and others, 2006). The marine transgression likely winnowed much of the surficial fine-grained sediment from glacial deposits on the inner shelf, and modern processes maintain an armored surface by transporting fine-grained sediments to deeper, more quiescent environments than nearshore environments (Stellwagen Basin, Cape Cod Bay, and offshore). North of Cape Ann in the southern Merrimack Embayment, the surficial sediments are shaped by events of the late Pleistocene and Holocene, specifically the deposition of a lowstand delta following deglaciation (Oldale and others, 1983). Subsequent reworking of the delta and fluvial units during the Holocene marine transgression liberated sand to form shoals, beaches, barriers, and estuaries. As a result, more than 200 km2 of the inner continental shelf is a broad low-relief ramp composed of sand and gravel that stands in contrast to the more complex sediment textural distribution within western Massachusetts Bay. Northeastern storms are the highest energy events north of Cape Ann and often result in significant beach erosion along the barrier island chain. Analysis of bedforms and wave data on the inner continental shelf indicates that strong northeastern storms are capable of generating bottom shear stresses that could rework the inner shelf sand sheet to water depths of 50 m (Hein and others, 2007). This would indicate that the modern inner continental shelf as far as 10 km offshore is capable of being mobilized and reworked during storms and the boundaries defining sediment texture in this study are subject to change as the sea floor continues to evolve.
|
|

![]() U.S. Department of the Interior |
U.S. Geological Survey
U.S. Department of the Interior |
U.S. Geological Survey
URL: http://pubsdata.usgs.gov/pubs/of/2015/1153/html/ofr20151153_discussion.html
Page Contact Information: GS Pubs Web Contact
Page Last Modified: Wednesday, 07-Dec-2016 21:45:28 EST