


The purpose of these interpretive discussions is to provide a perspective on regional- and national-scale variations in element and mineral distributions in soils and their likely causes. The significant spatial variations shown by most elements and minerals can commonly be attributed to geologic sources in underlying parent materials, but other spatial variations seem clearly related to additional factors such as climate, the age of soils, transported source material, and anthropogenic influences. We attempt to distinguish the influence of these various factors on a regional and national scale. Numerous more local features might similarly be related to these same factors, but these features also have some probability of being an artifact of a random sampling of variable compositions, so that there is some probability of samples with similar compositions occurring in clusters of two or more adjacent sites by chance. Distinguishing such random occurrences from true variability is beyond the scope of the data from which these maps are constructed. Some caution, therefore, is advisable in interpreting the significance of these more local features unless some unique sources or processes can clearly be related to them.
Molybdenum (Mo) is a metallic trace element used primarily in the manufacture of steel alloys to increase strength, hardness, electrical conductivity, and resistance to corrosion. These alloys are used in engines, heating elements, drills, and saw blades. Compounds of Mo are used as lubricants and catalysts for the petroleum industry. Molybdenum is an essential element for all organisms. In plants, it is a component of enzymes used in nitrogen fixation. It is toxic in anything but small amounts; however, both Mo deficiency and excess can cause health problems in humans and animals.
Molybdenum in soils is largely inherited from parent materials. The abundance of Mo in the Earth's upper continental crust is estimated to be about 0.6 milligrams per kilogram (mg/kg) (Hu and Gao, 2008). Molybdenum is somewhat enriched in felsic rocks, such as granite or rhyolite, with an average concentration of about 1.5 mg/kg. Sedimentary rocks, especially shale, which has an average Mo concentration of about 2 mg/kg, as well as unconsolidated materials such as alluvial, eolian, or glacial deposits all may contribute Mo to soils.
Ore deposits containing Mo and a suite of other elements, including copper (Cu), gold (Au), antimony (Sb), mercury (Hg), and tungsten (W), are widespread throughout the western United States. Most of these deposits are genetically related to intrusions of felsic rocks. Molybdenum does not substitute into silicate minerals, and in mineral deposits Mo typically occurs in sulfides, such as molybdenite (MoS2), or oxides, such as powellite (CaMoO4). The distribution of mineral resource deposits with Mo as a commodity (major or minor) in the United States, extracted from the U.S. Geological Survey (USGS) Mineral Resource Data System (MRDS) website, can be seen by hovering the mouse here. Statistics and information on the worldwide supply of, demand for, and flow of Mo–bearing materials are available through the USGS National Minerals Information Center (NMIC) website.
In soils, many primary minerals containing Mo break down, releasing Mo anions. Molybdenum anions are unable to enter silicate mineral structures, but they can fix onto clay surfaces, adsorb to iron (Fe) oxides and hydroxides, or bind to organic matter (Kabata-Pendias, 2001). Molybdenum is a micronutrient in soils and is variably taken up by plants.
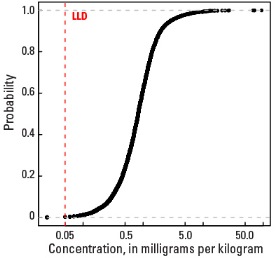
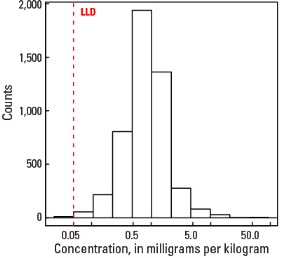
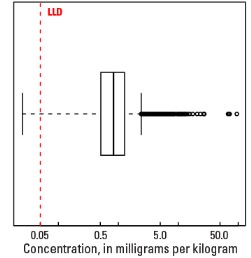
In our data, the median Mo concentration is 0.83 mg/kg in the soil C horizon and 0.78 mg/kg in both the top 0- to- 5-cm layer and the soil A horizon (see the summary statistics [open in new window]). Less than 1 percent of all samples have Mo concentrations below the lower limit of determination (LLD) of 0.05 mg/kg.
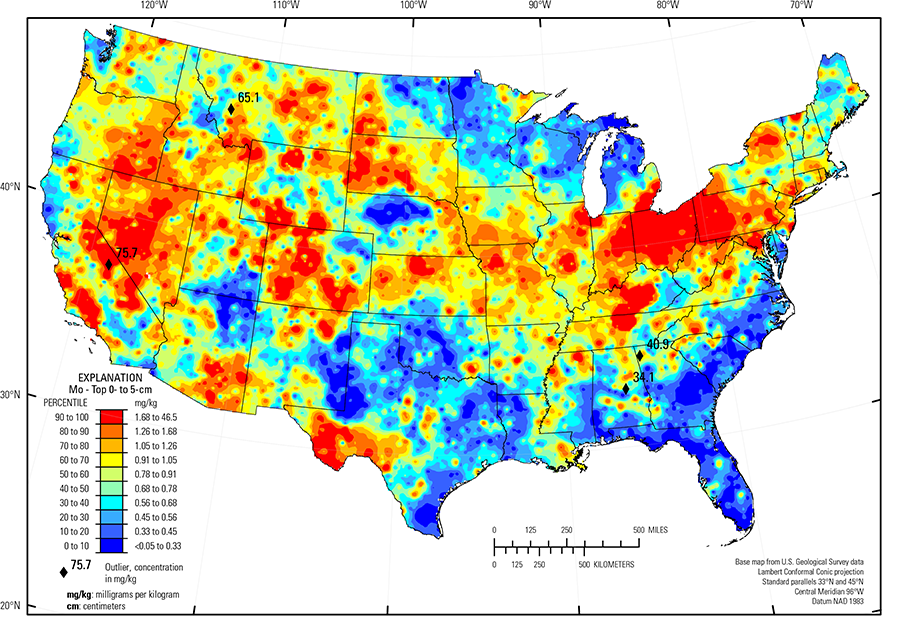
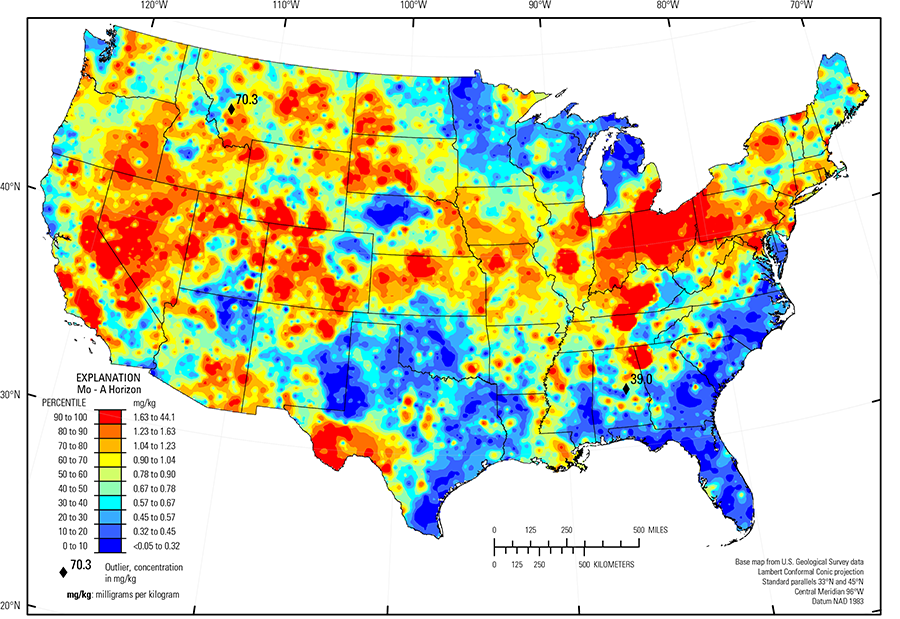
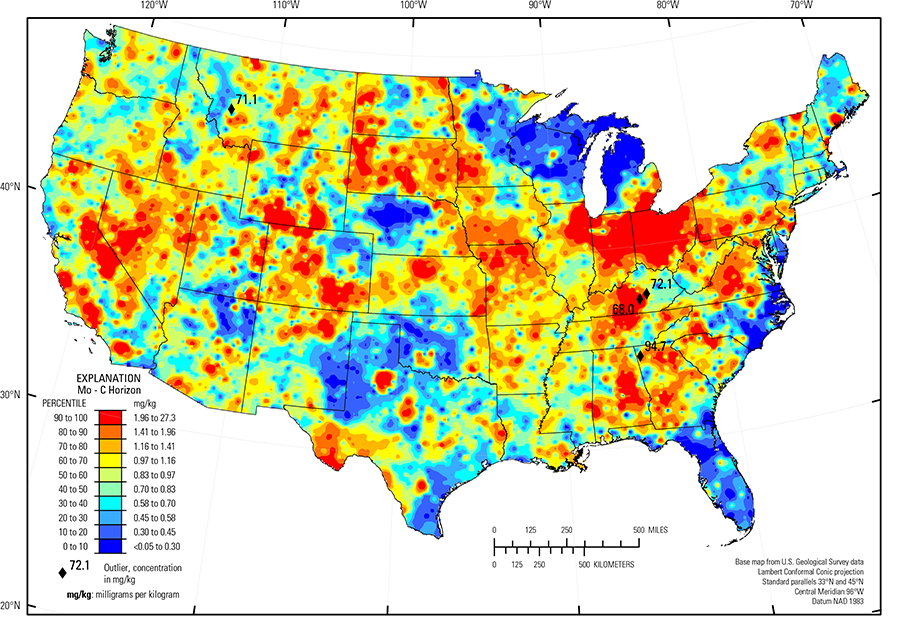
Anomalously high Mo concentrations in the soil C horizon (four sites), the soil A horizon (two sites), and the top 0- to 5-cm layer (four sites) were removed prior to constructing the interpolated maps and are shown as diamond symbols on the maps. The broad spatial map patterns for Mo among the three sample types are generally similar to one another, although marked differences exist in local areas.
Higher Mo concentrations occur in soils across the West in areas of felsic rocks, at times mineralized, and unconsolidated sediments derived from felsic rocks. Examples of such areas and possible soil parent materials include:
- Basin and Range (Fenneman and Johnson, 1946), which contains major metallogenic provinces related to granitic rocks, characterized by Au, W, Sb, Mo, and Hg mineralization;
- Southern Sierra Nevada Mountains and Southern California Mountains (USDA, 2006), where granitic and hydrothermally altered rocks contain numerous Mo deposits;
- Trans–Pecos volcanics (Schruben and others, 1997), with soil developed on rhyolite, alkalic volcanic rocks and related alluvium; and
- Areas in the Central and Southern Rocky Mountains (USDA, 2006), which include the Colorado Mineral Belt and the Butte mineral district, in Montana.
Elevated Mo concentrations occur in soils developed on shale in western and central South Dakota, eastern Montana, and the Upper Arkansas Valley Rolling Plains (USDA, 2006) in southeastern Colorado. In western Pennsylvania, West Virginia, Kentucky, Tennessee, and northern Georgia soils developed on cyclic beds of shale and sandstone or associated colluvium have somewhat elevated Mo concentrations. In Kentucky, soils with the highest Mo concentrations measured in this study developed on a thin unit of black shale that encircles the Kentucky Bluegrass (USDA, 2006). Among shale types, black shale has high organic carbon concentrations and often related high metal concentrations. In black shale, Mo may originally occur as a sulfide; if oxidized, released Mo is retained by binding to organic matter.
Black shale also contributes to the striking Mo pattern in soils across the lower Great Lakes region. In the Upper Midwest, melting of glacial ice following late Wisconsinan period advances (16,000 to 12,000 years ago) left the region north of the southern glacial limit (Soller and others, 2012) mantled with a blanket of mixed, immature sediments from which present–day soils developed. Individual ice lobes (Grimley, 2000) created distinct patterns in soil mineralogy and geochemistry because of varying provenance and ice transport paths. 'Gray' (carbonate– and shale–rich) till in the James and Des Moines lobes (Grimley, 2000) was derived from Cretaceous sedimentary rocks (dolostone, limestone, and shale). These gray tills have relatively high Mo concentrations (best seen in the map for the soil C horizon) likely from the shale contribution. In contrast, 'red' quartz– and feldspar–rich till in central Minnesota, northern Wisconsin, and northwestern Michigan have a Precambrian crystalline rock/red sandstone provenance, with no material derived from shale, and thus, soils have low Mo concentrations. Soils with very high Mo concentrations in northern Illinois, eastern Indiana, eastern Michigan, and western Ohio developed on glacial deposits that incorporated black shale clasts. This shale signature was created by ice of the Lake Michigan Lobe and Huron–Erie Lobes (Grimley, 2000), which spread black shale material well beyond where the bedrock is exposed in central Ohio. Black shale in these glacial lobes contributes more Mo to soils (for example, concentrations greater than 10 mg/kg with a maximum concentration of 26.4 mg/kg Mo in the soil C horizon in Ohio) than the Cretaceous 'gray' shale (maximum about 3 to 4 mg/kg Mo in the soil C horizon) in the James and Des Moines lobes in Minnesota and South Dakota.
Small concentrations of Mo are present in the soil C horizon throughout the Piedmont (Fenneman and Johnson, 1946) and sporadically throughout the Gulf and Atlantic Coastal Plain (Fenneman and Johnson, 1946), where Mo released by weathering is likely adsorbed to Fe hydroxides or clays in these intensely weathered, clay–rich soils.
Examples of areas with relatively low concentrations of Mo in soils, likely because of a dearth of Mo in soil parent materials, are:
- Colorado Plateau (USDA, 2006) (quartz–rich sandstone and eolian deposits);
- Central High Plains, Southern Part (USDA, 2006) in eastern Colorado, and the Southern High Plains (USDA, 2006) of eastern New Mexico, northwestern Texas, and western Oklahoma (quartz–rich eolian sands and alluvial sediments); and
- Nebraska Sand Hills (USDA, 2006) (an area of unconsolidated sand dunes and sand sheets with soils dominated by quartz and plagioclase feldspar).
For many sites, the concentration of Mo in the soil C horizon is similar to the Mo concentration in the soil A horizon and the top 0- to 5-cm layer. In the Piedmont (Fenneman and Johnson, 1946) and sporadically throughout the Gulf and Atlantic Coastal Plain (Fenneman and Johnson, 1946), however, Mo concentrations are generally lower in topsoils (soil A horizon and top 0- to 5-cm layer) than in the soil C horizon. In a few local areas, the concentration of Mo in the topsoils exceeds Mo concentration in the soil C horizon. In these instances, it is possible that (1) Mo was transferred to surface soils during mineral processing or, (2) because Mo has many uses in modern society, it was potentially introduced into soil by other human activity.
Statistics - 0 TO 5 CM
| Number of samples | 4,841 |
| LLD | 0.05 mg/kg |
| Number below LLD | 11 |
| Minimum | <0.05 mg/kg |
| 5 percentile | 0.24 mg/kg |
| 25 percentile | 0.51 mg/kg |
| 50 percentile | 0.78 mg/kg |
| 75 percentile | 1.14 mg/kg |
| 95 percentile | 2.27 mg/kg |
| Maximum | 75.7 mg/kg |
| MAD | 0.46 mg/kg |
| Robust CV | 58.9% |
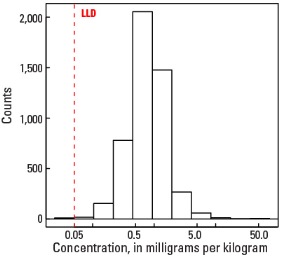
Histogram
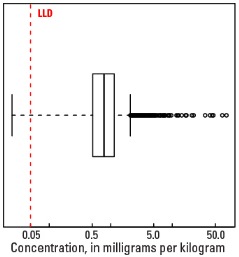
Boxplot
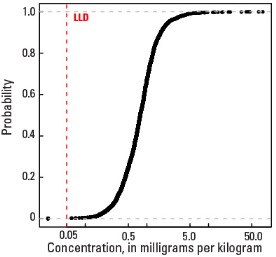
Empirical cumulative distribution function
Statistics - A Horizon
| Number of samples | 4,813 |
| LLD | 0.05 mg/kg |
| Number below LLD | 7 |
| Minimum | <0.05 mg/kg |
| 5 percentile | 0.24 mg/kg |
| 25 percentile | 0.50 mg/kg |
| 50 percentile | 0.78 mg/kg |
| 75 percentile | 1.13 mg/kg |
| 95 percentile | 2.22 mg/kg |
| Maximum | 70.3 mg/kg |
| MAD | 0.445 mg/kg |
| Robust CV | 57 % |
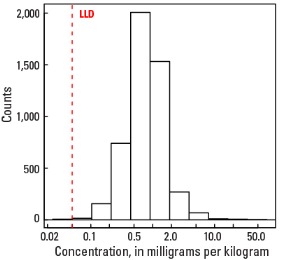
Histogram

Boxplot

Empirical cumulative distribution function
Statistics - C Horizon
| Number of samples | 4,780 |
| LLD | 0.05 mg/kg |
| Number below LLD | 11 |
| Minimum | <0.05 mg/kg |
| 5 percentile | 0.20 mg/kg |
| 25 percentile | 0.51 mg/kg |
| 50 percentile | 0.83 mg/kg |
| 75 percentile | 1.27 mg/kg |
| 95 percentile | 2.88 mg/kg |
| Maximum | 94.70 mg/kg |
| MAD | 0.534 mg/kg |
| Robust CV | 64.3 % |
Histogram
Boxplot