Figures for Open-File Report 00-124
(Select an image for larger version where available)
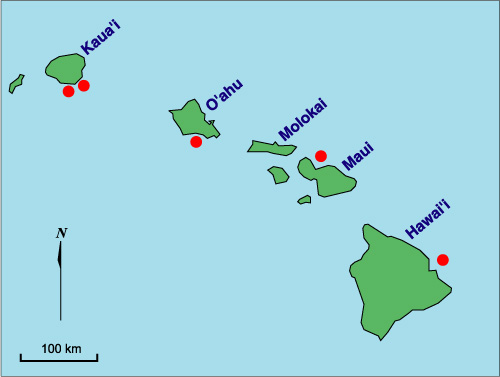
Figure 1 |
Study area map |
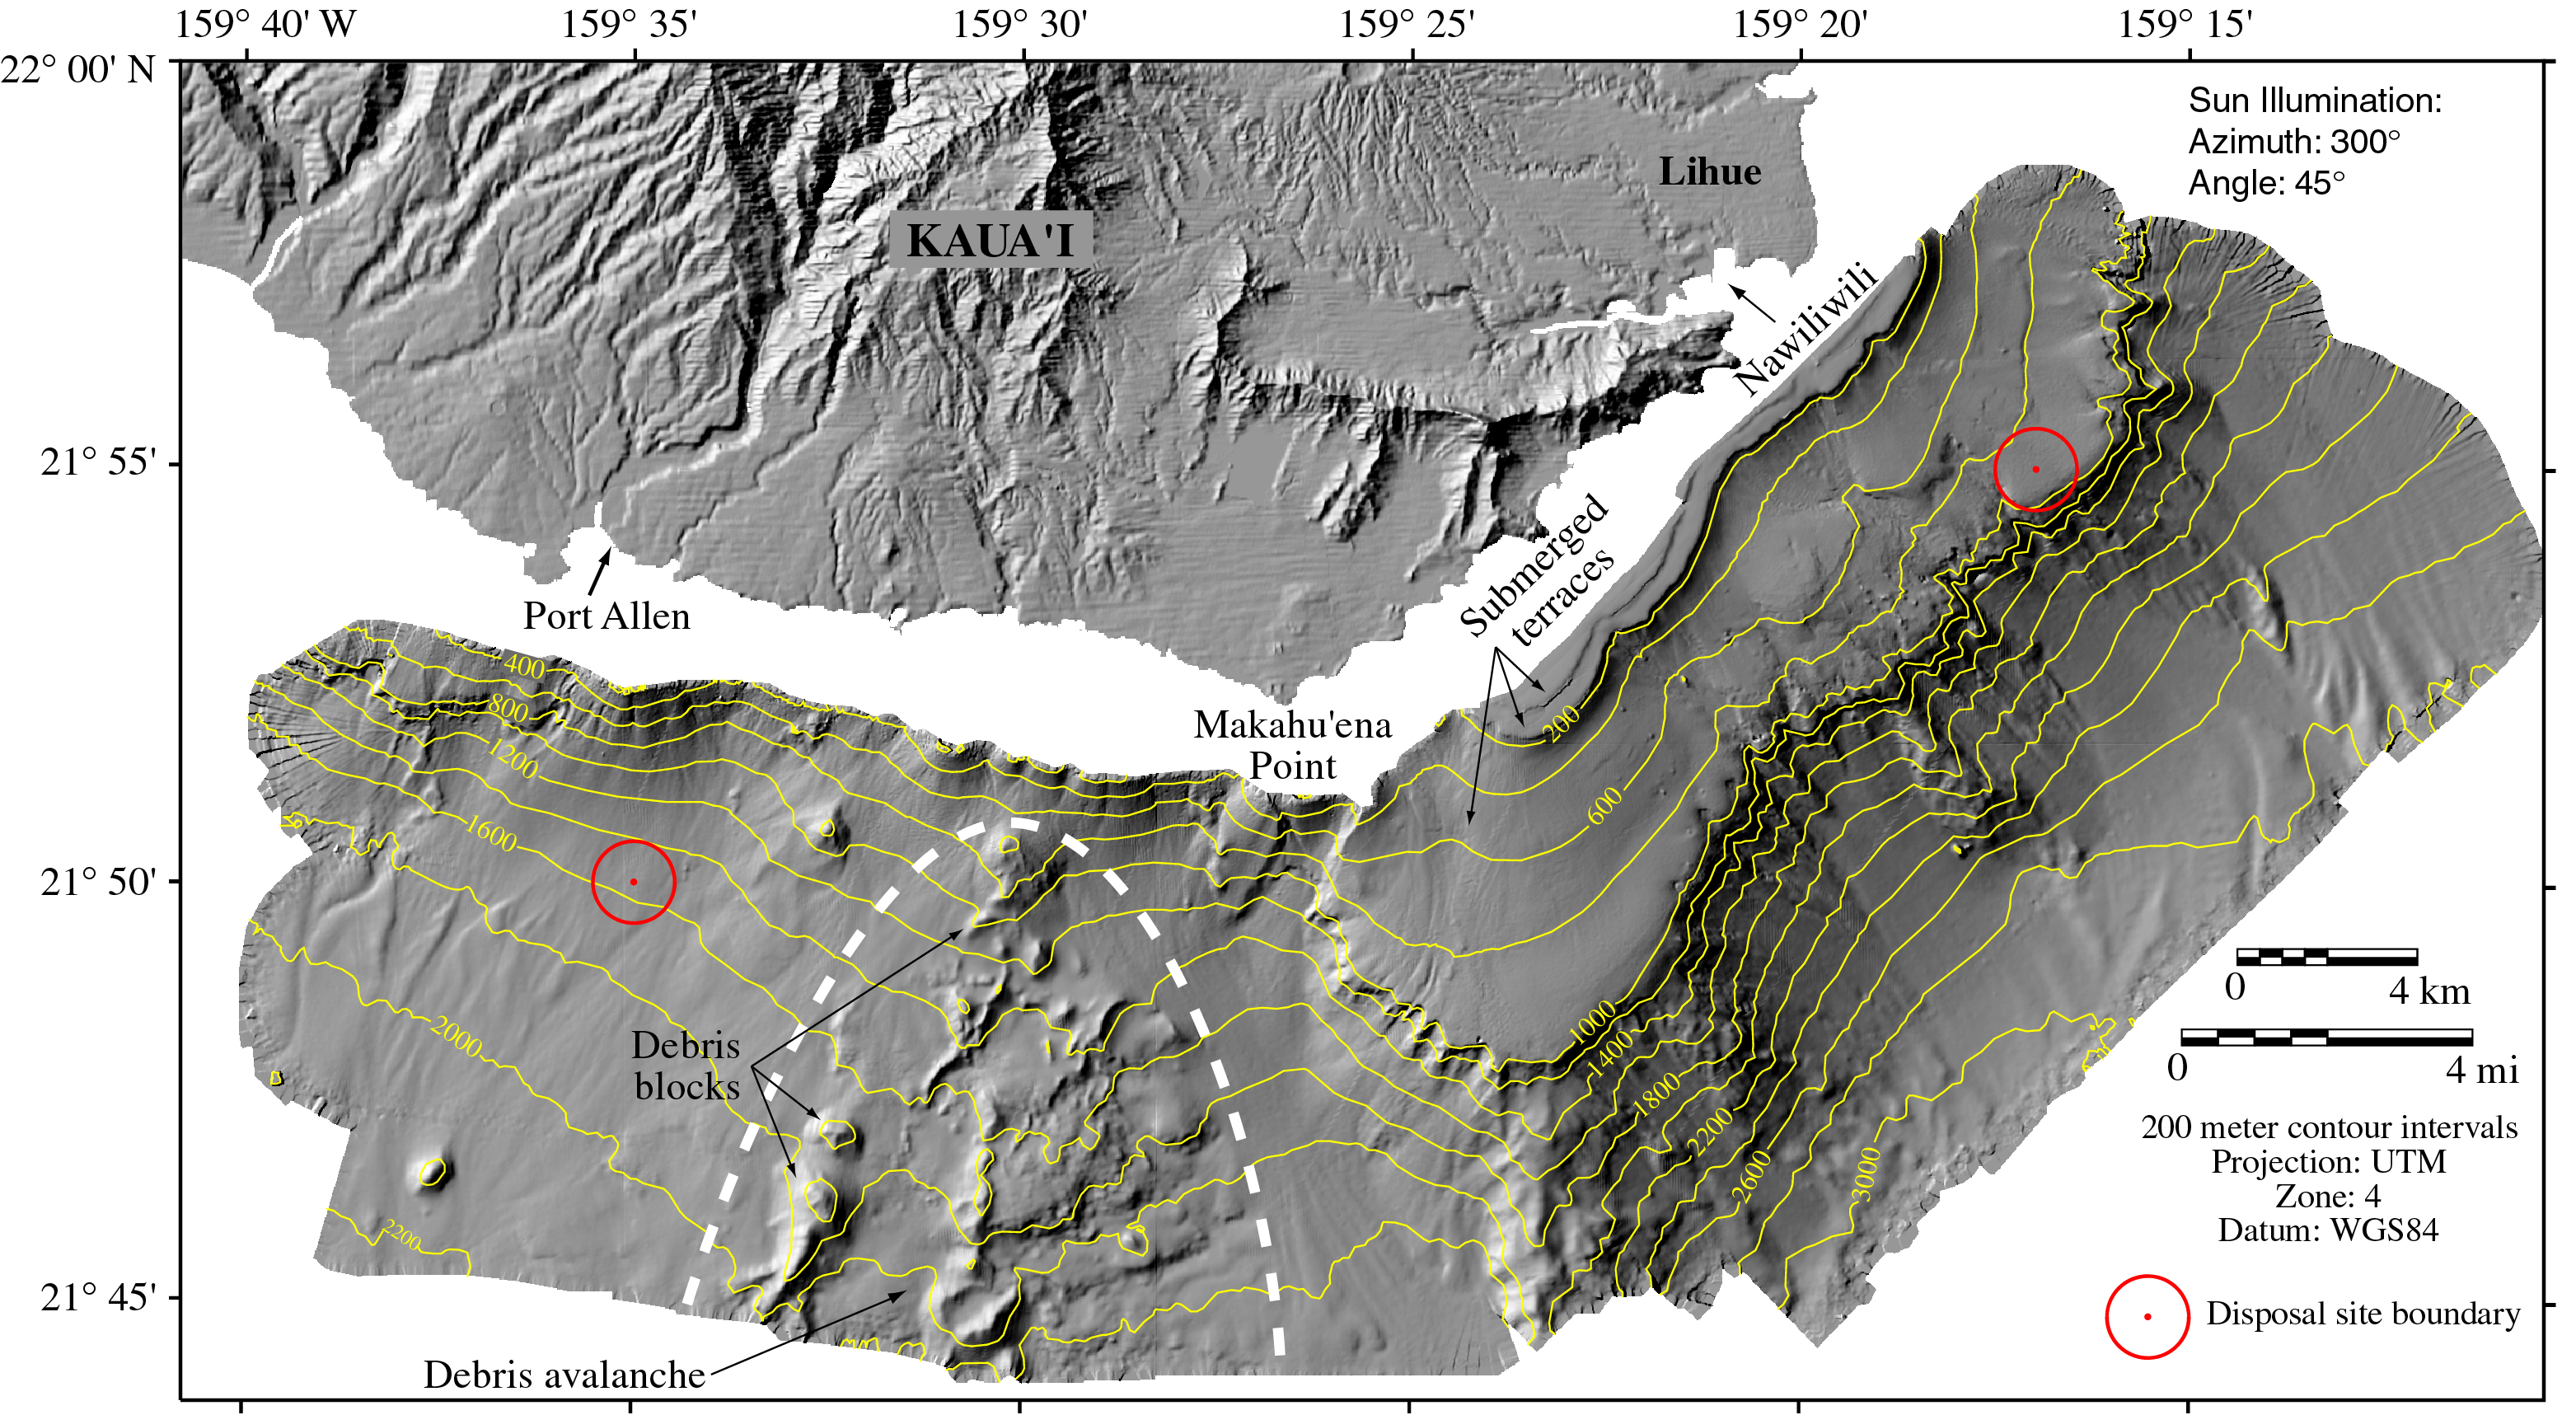
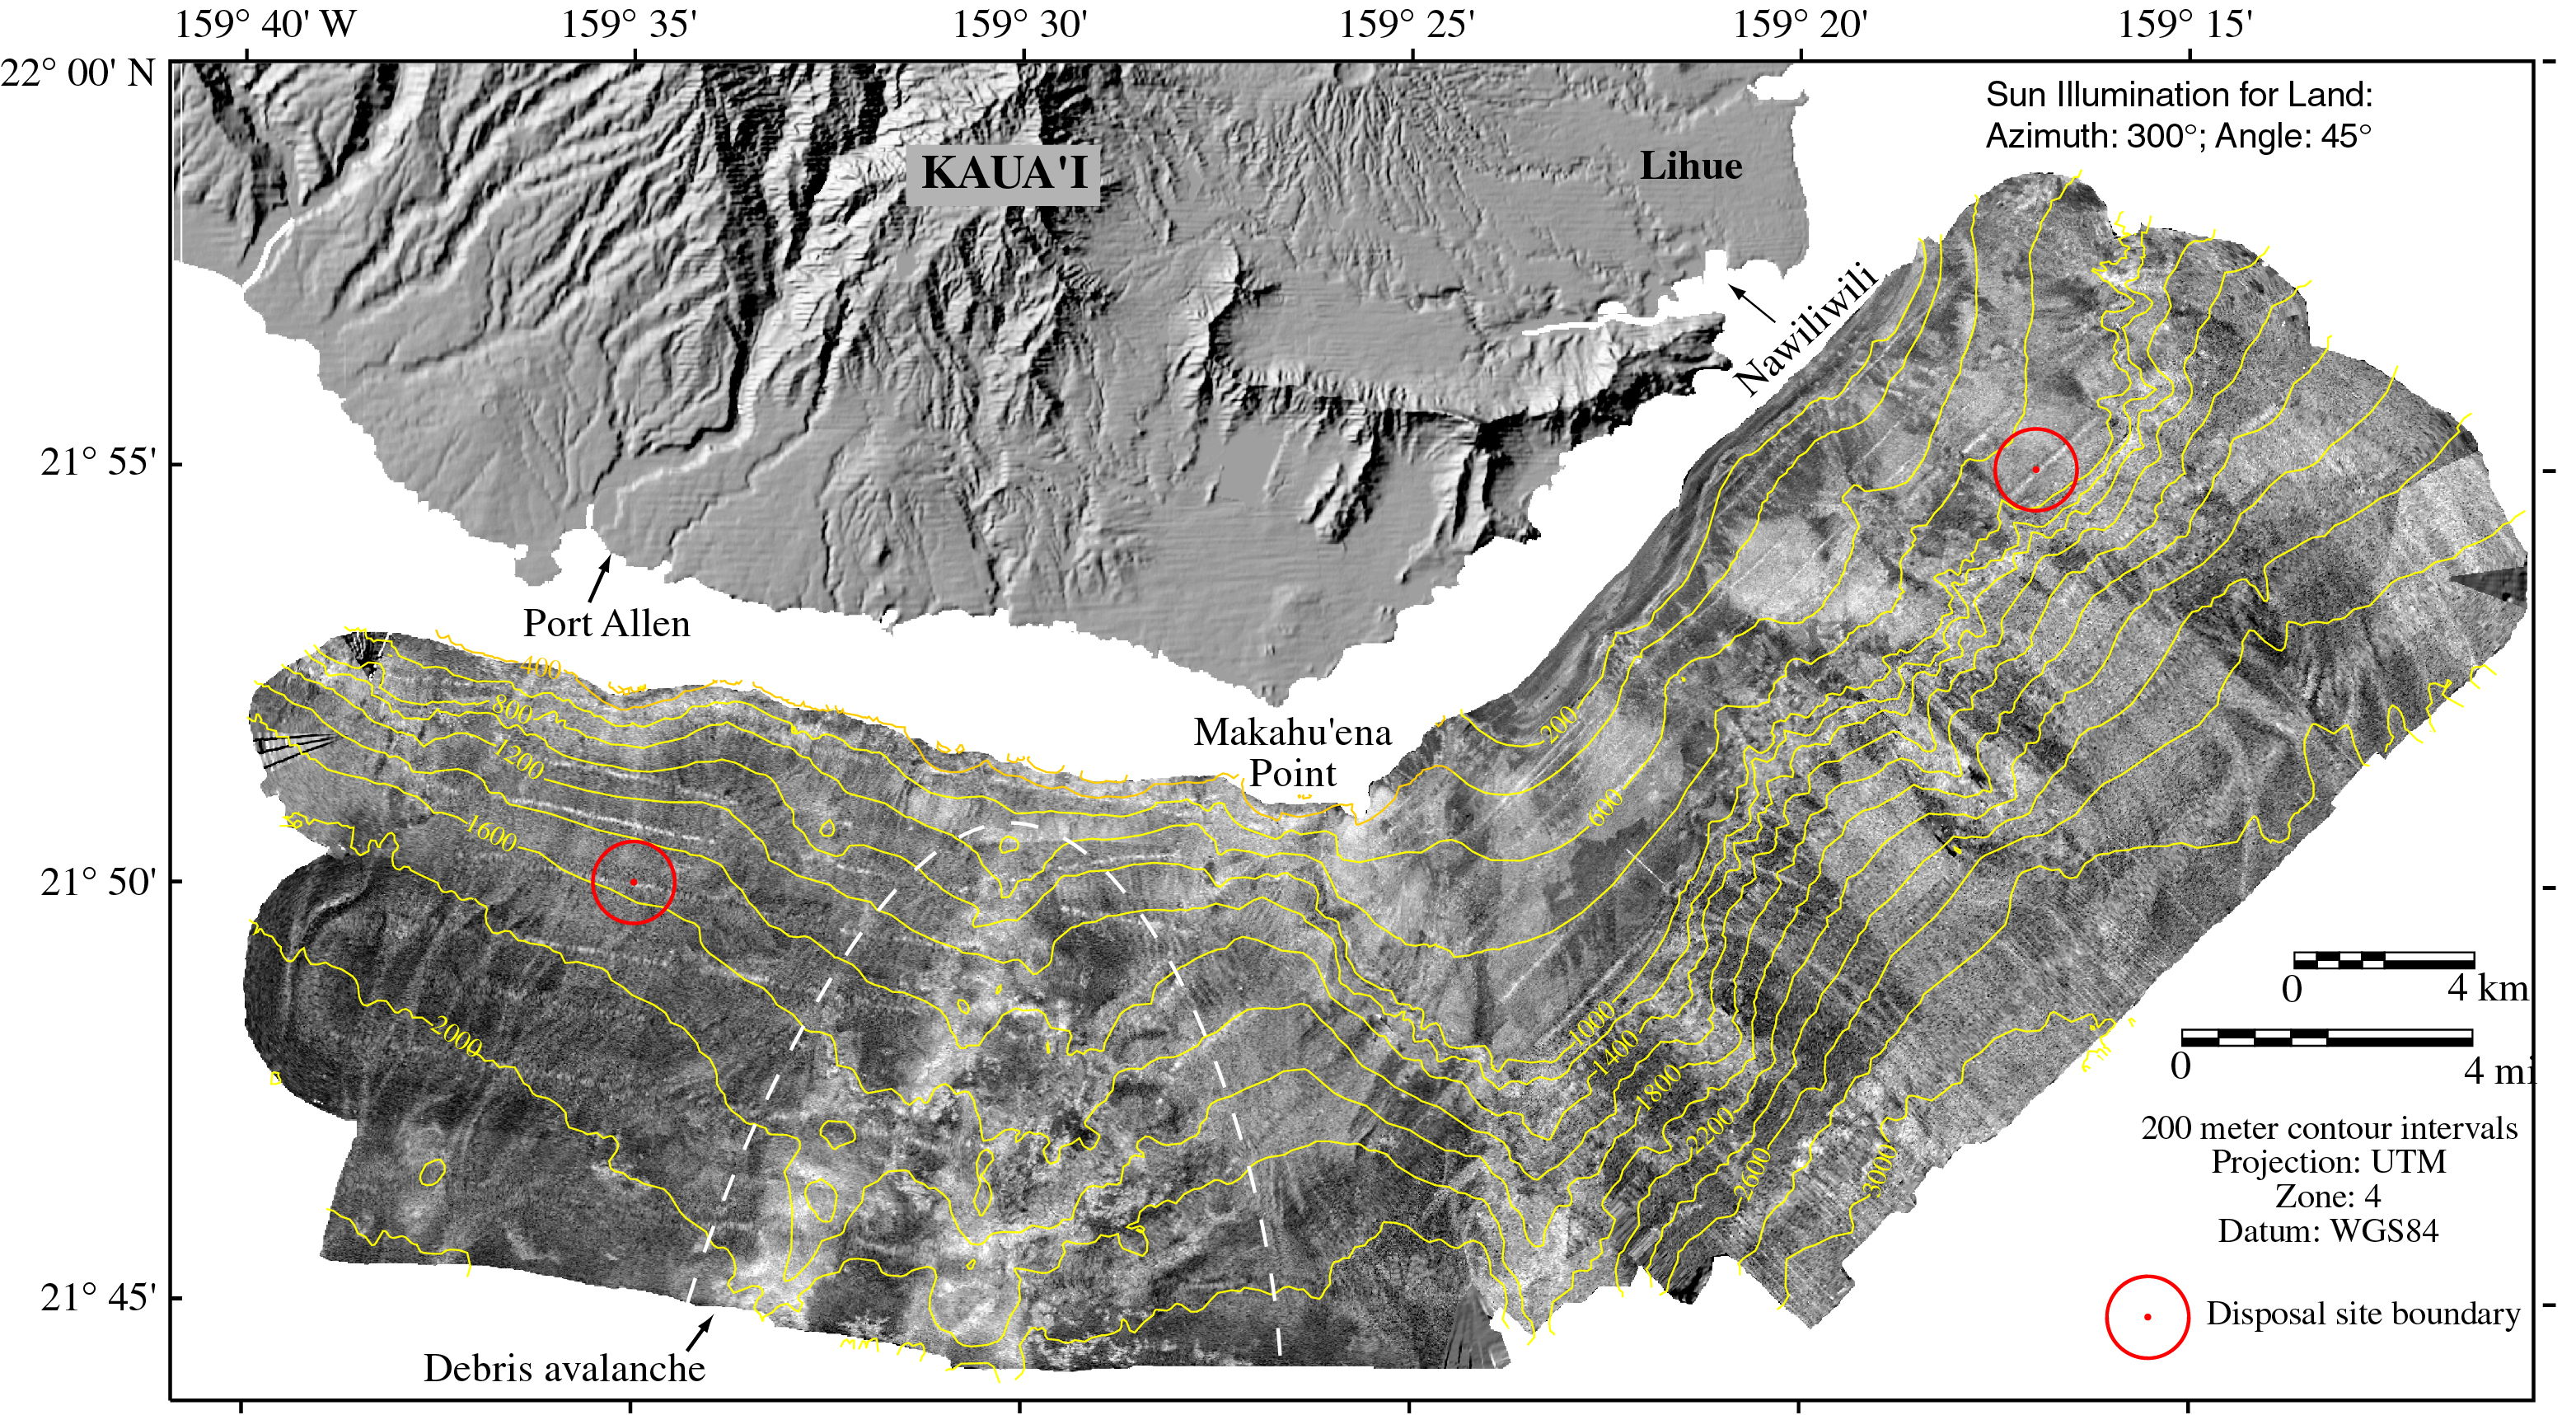
Figure 2 |
Note the contrasting morphological styles of each coast reflecting major growth and mass-wasting processes characteristic of the Hawaiian Islands. The morphology of the region between Port Allen and Makahu�ena Point on the southwest flank of Kaua�i is the upper portion of a gigantic submarine debris avalanche. The insular shelf and slope collapsed catastrophically and was transported downslope. Note the large blocks and associated debris that forms a cone-shaped deposit in the central part of the image.
The seafloor morphology of the upper southeast margin of Kaua�i between Makahu�ena Point and Nawiliwili is composed of a relatively broad, gentle, southeasterly sloping terrace. The terrace is 10-13 km wide and trends northeasterly about 45 km. This terrace was constructed by lavas during a sea level low stand. Note the abrupt change of slope at the seaward edge of the terrace, which marks the position of the shoreline when the terrace was created. The steep change in slope at the outer terrace reflects the increased slope angle that occurs when lava passes from land to sea. The terrace was subsequently submerged as sea level rose concomitantly with island subsidence. |
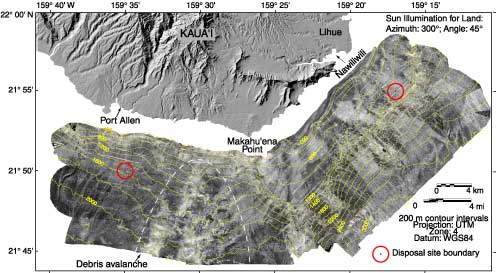
Figure 3 |
The backscatter data from the southwest margin between Makahu'ena Point and Port Allen shows that the debris avalanche blocks and associated deposits are characterized by high backscatter. The debris avalanche deposits form three high-backscatter features about 10 km long by 4 km wide each that trend nearly north-south in the central portion of the southwest flank. The remainder of the image surrounding the avalanche debris is characterized by a complex, high-backscatter, dendritic pattern. These high-backscatter dendritic features probably represent pathways (gullies, chutes, or canyons) for downslope sediment transport.
Backscatter data from the southeast margin of Kaua'i between Makahu'ena Point and Nawiliwili shows that the steep seaward edge of the submerged terrace is incised with high-backscatter gullies and canyons that coalesce downslope into broad, high-backscatter deposits. The broad areas of high backscatter on the lower slope correspond to the broader, smooth, lower-slope sediment mantle visible in the shaded-relief map. |
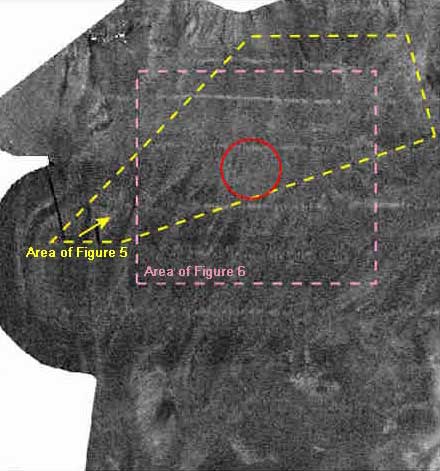
Figure 4 |
Note the lack of visible high-backscatter dredged material deposits at the Port Allen disposal site like those visible in the multibeam image from offshore Honolulu. Scale across bottom of image is about 12.2 km. The disposal site boundary is outlined by a red-colored circle with a 6000 ft (1829.2 m) diameter. |
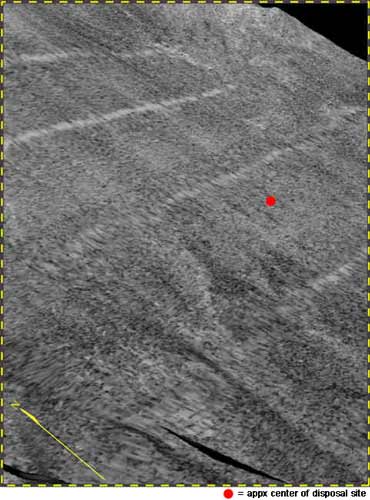
Figure 5 |
See Figure 4 for view orientation. There are no visible high-backscatter dredged-material deposits. Scale across bottom of image is about 5 km. |
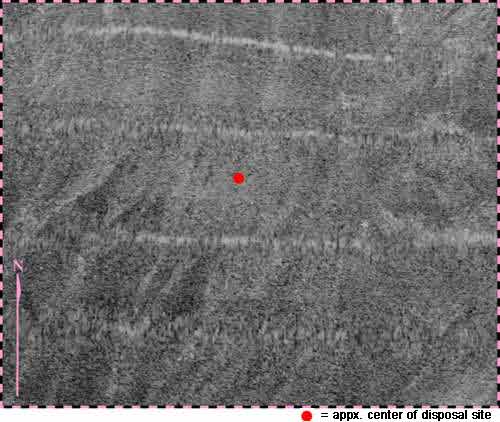
Figure 6 |
See Figure 4 for view orientation. Note that there are no visible high-backscatter dredged material deposits. Scale across bottom of image is about 8.5 km. |
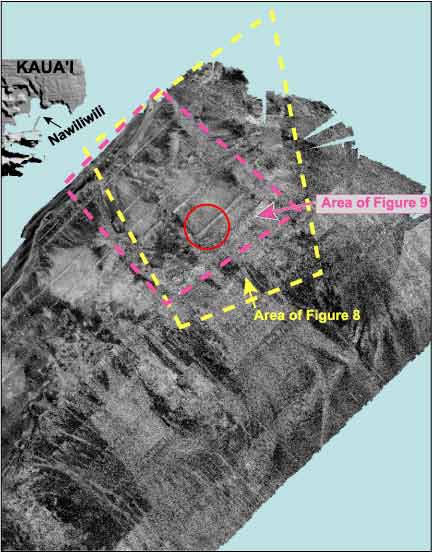
Figure 7 |
Note that there are no visible high-backscatter deposits. Scale across the bottom of the image is about 18.52 km. Disposal site is defined by a circle with a diameter of 1.83 km. |
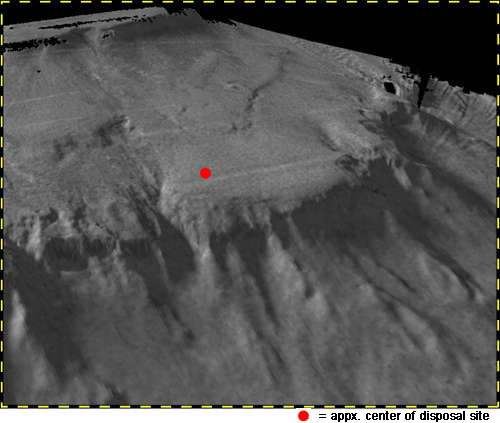
Figure 8 |
See Figure 7 for view orientation. Note that there are no visible dredged material deposits. Scale across bottom of image is about 14.5 km. VE = 3x. |
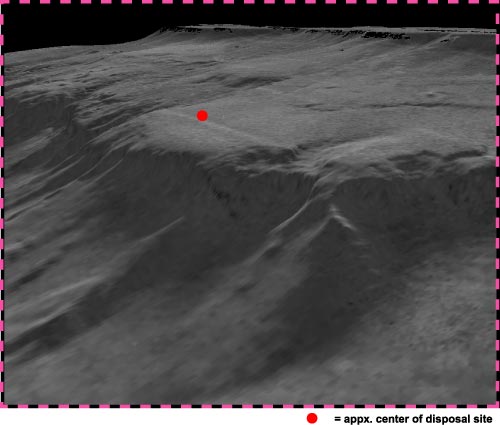
Figure 9 |
See Figure 7 for view orientation. Note that there are no visible dredged material deposits. Scale across bottom of image is about 14.3 km. VE = 3x. |
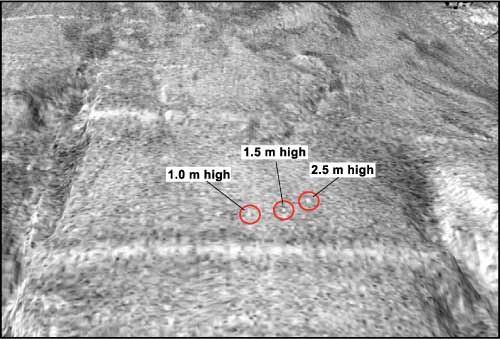
Figure 10 |
These high-backscatter features have relief ranging from 0.5 m to 2.5 m. Three mounds are circled. Distance across the top of image is 6.4 km. Distance across the bottom of image is 2.9 km. Depth of field is 4.2 km. Water depth in the area is about 890 m. |
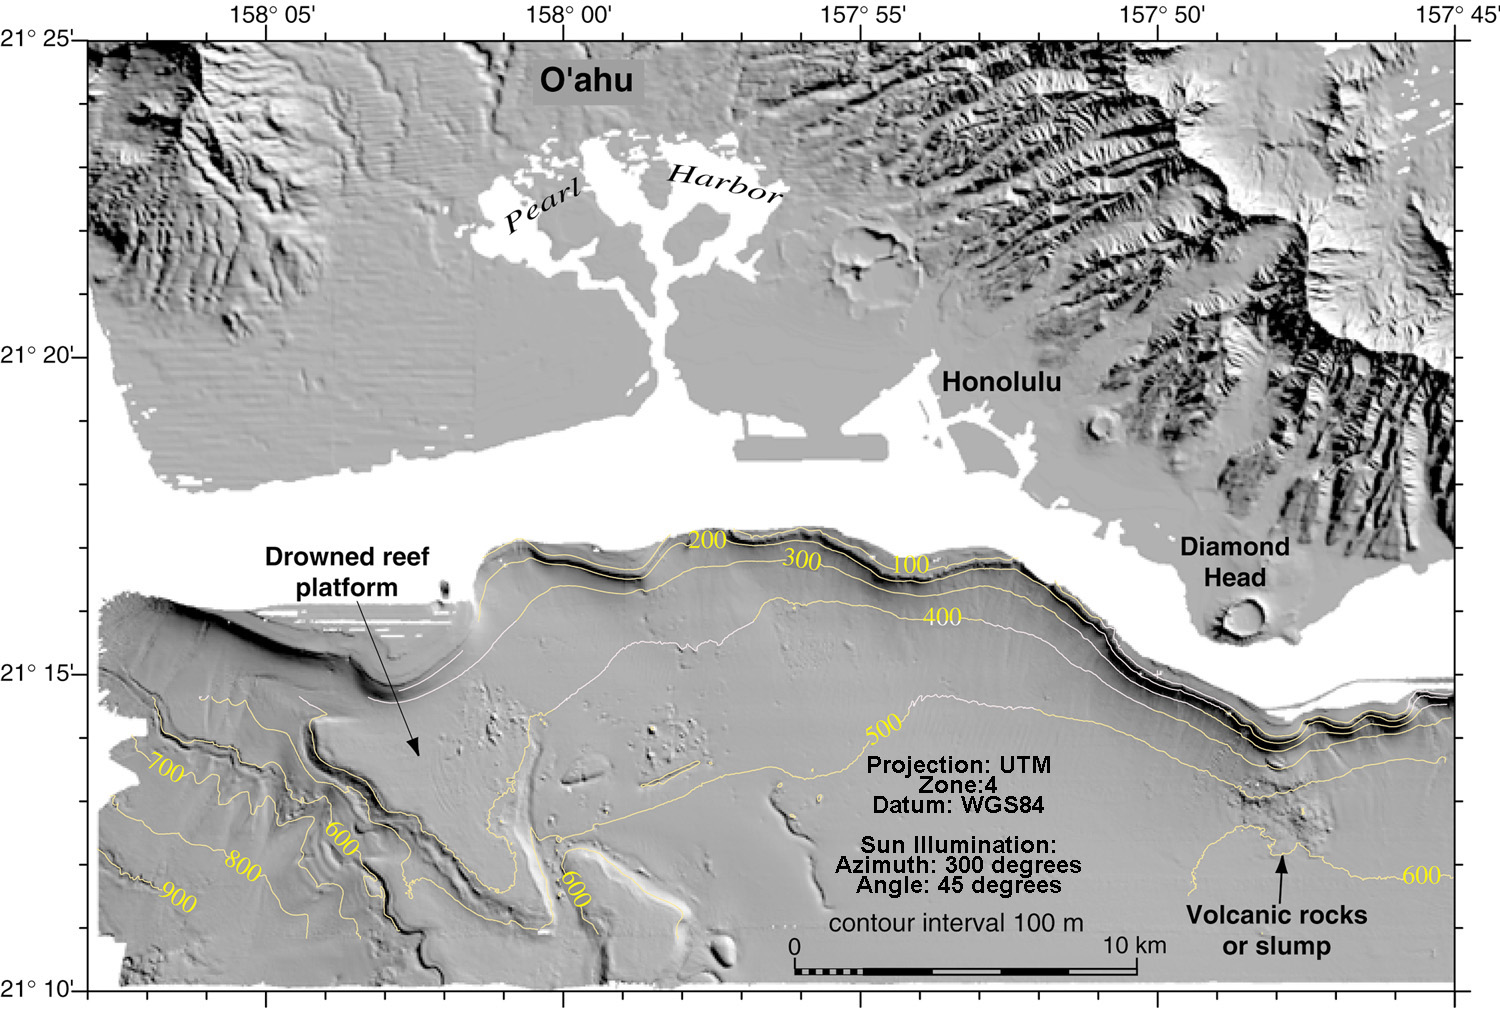
Figure 11 |
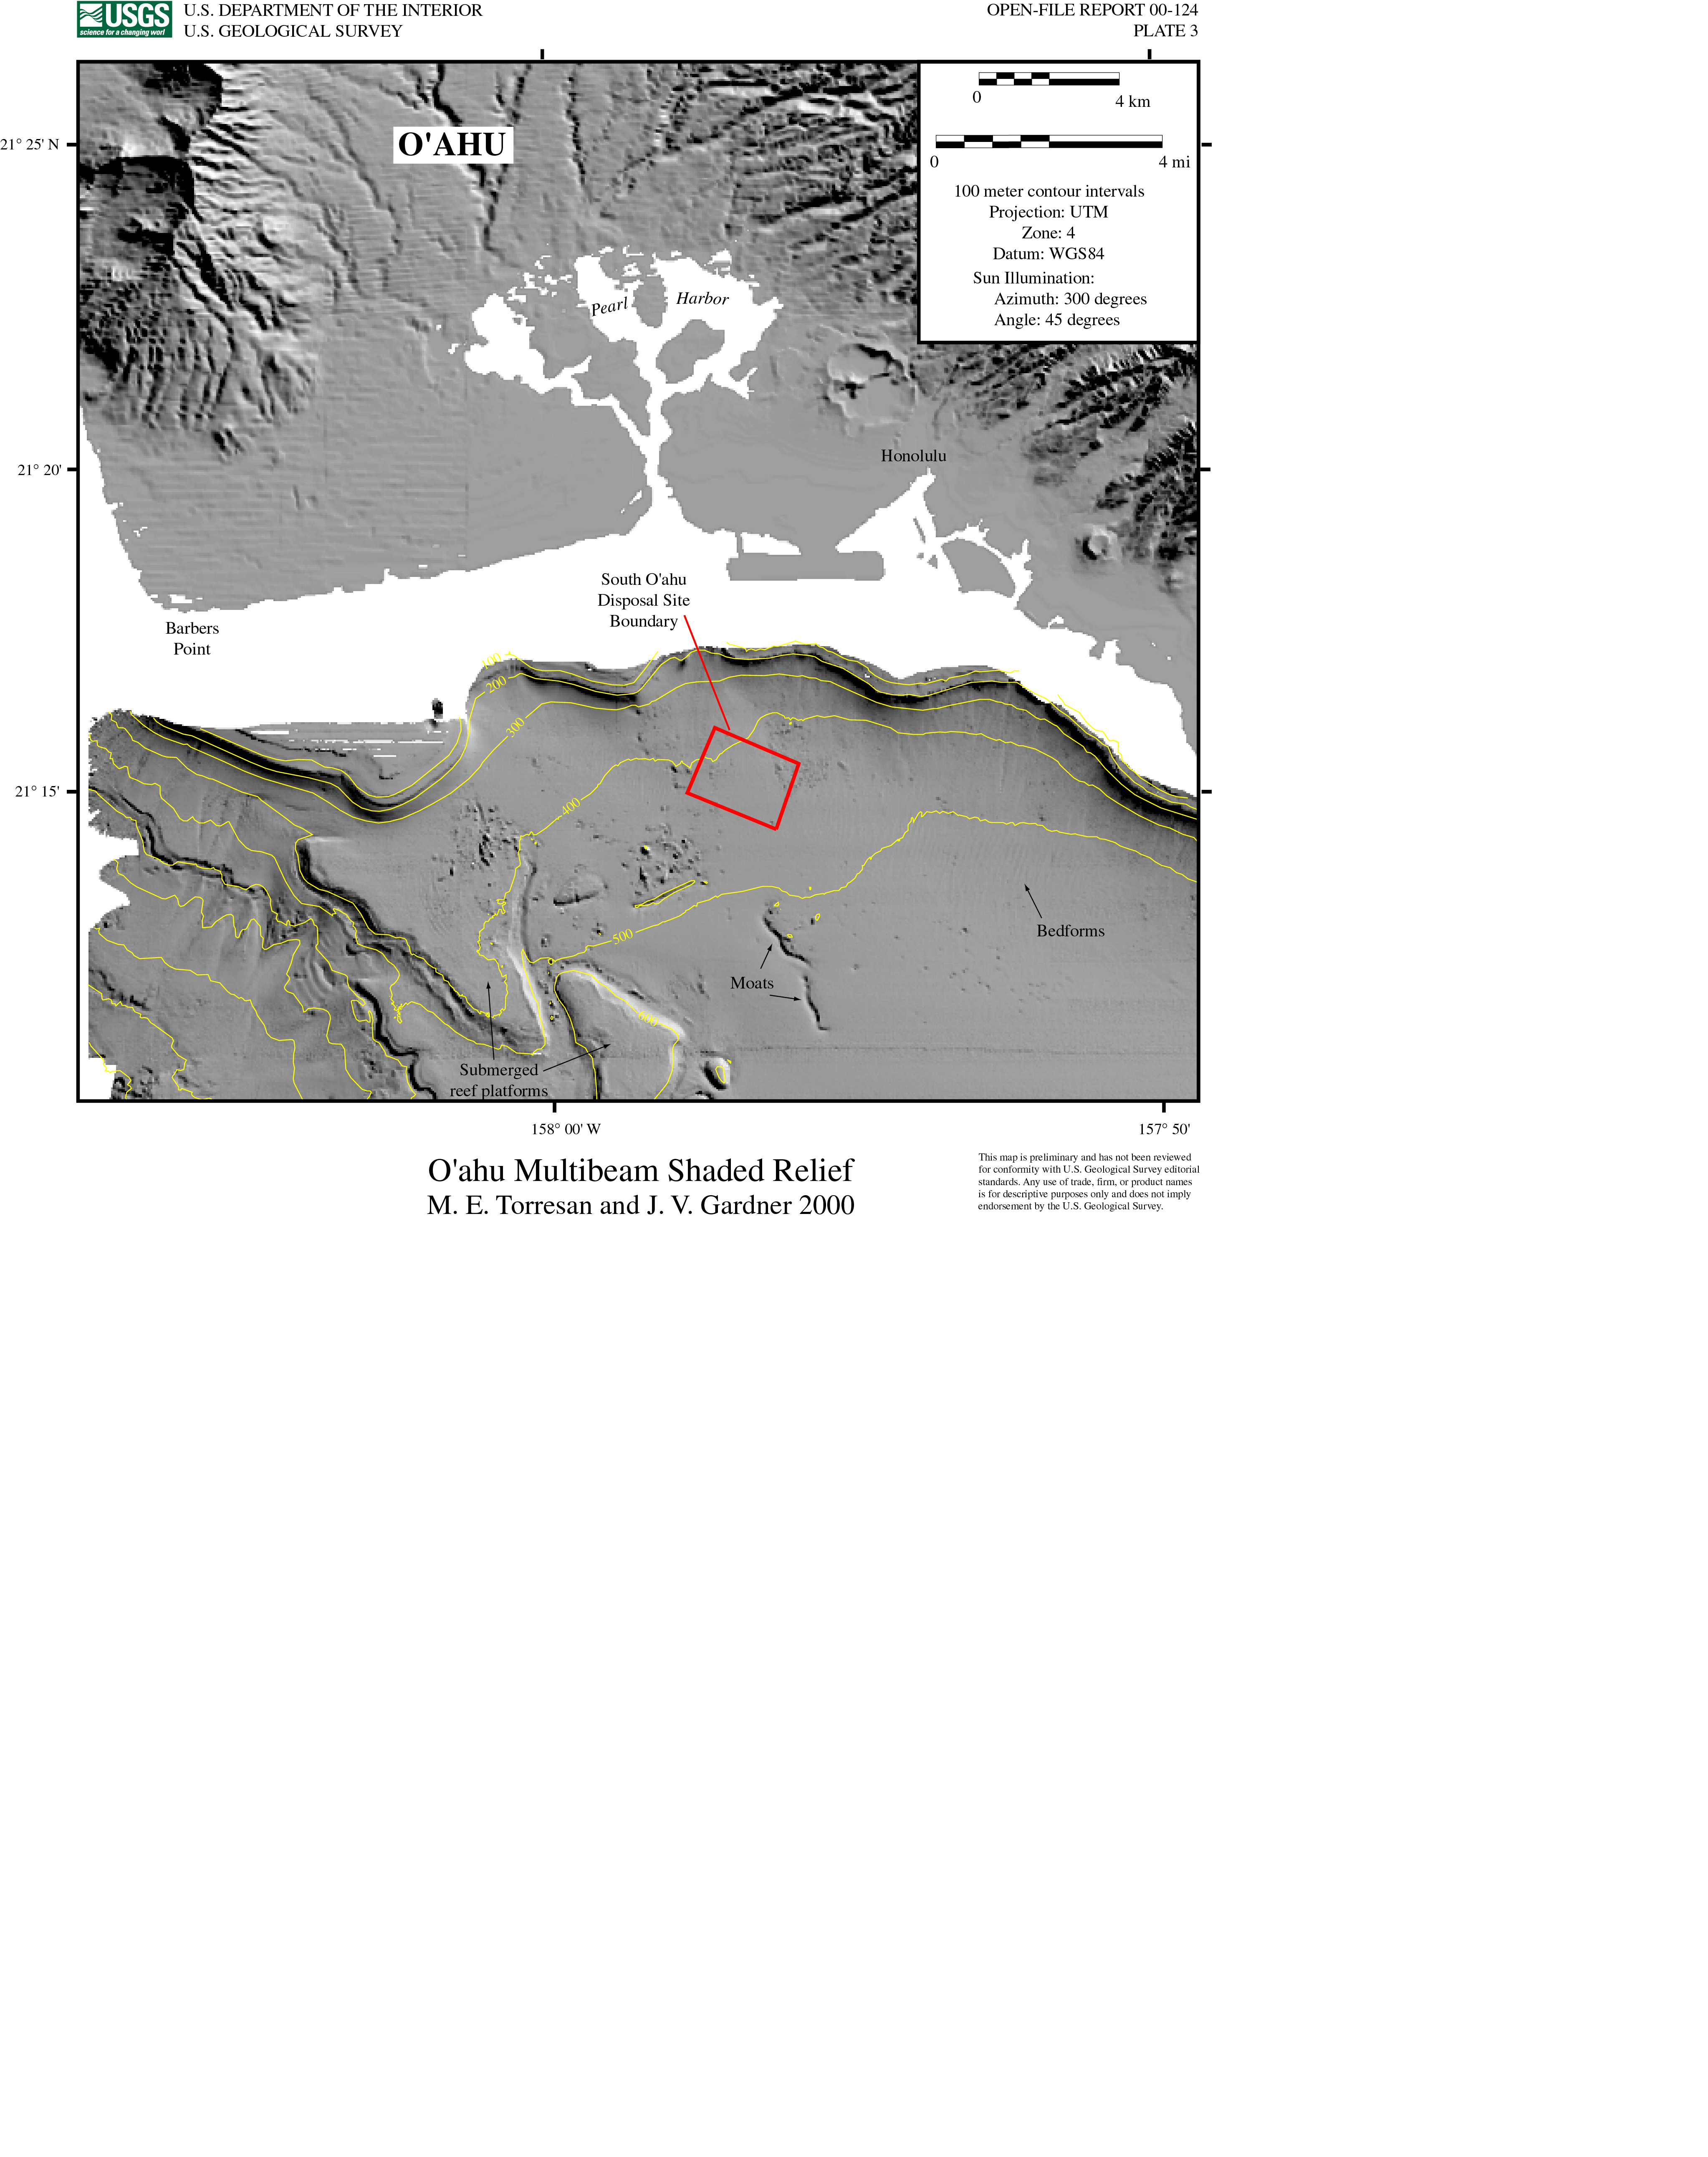
Map shows volcanic or slump features and drowned reef platforms, pinnacle reefs, and moats on down current side of reefs. Compare to shaded-relief map in Plate 3 and backscatter maps in Figures 12 and 13, and Plate 4. Note that large bedforms are visible in Plate 3 but do not appear in Figure 11 owing to map scale. Sun illumination: azimuth 345 degrees; angle 45 degrees. |
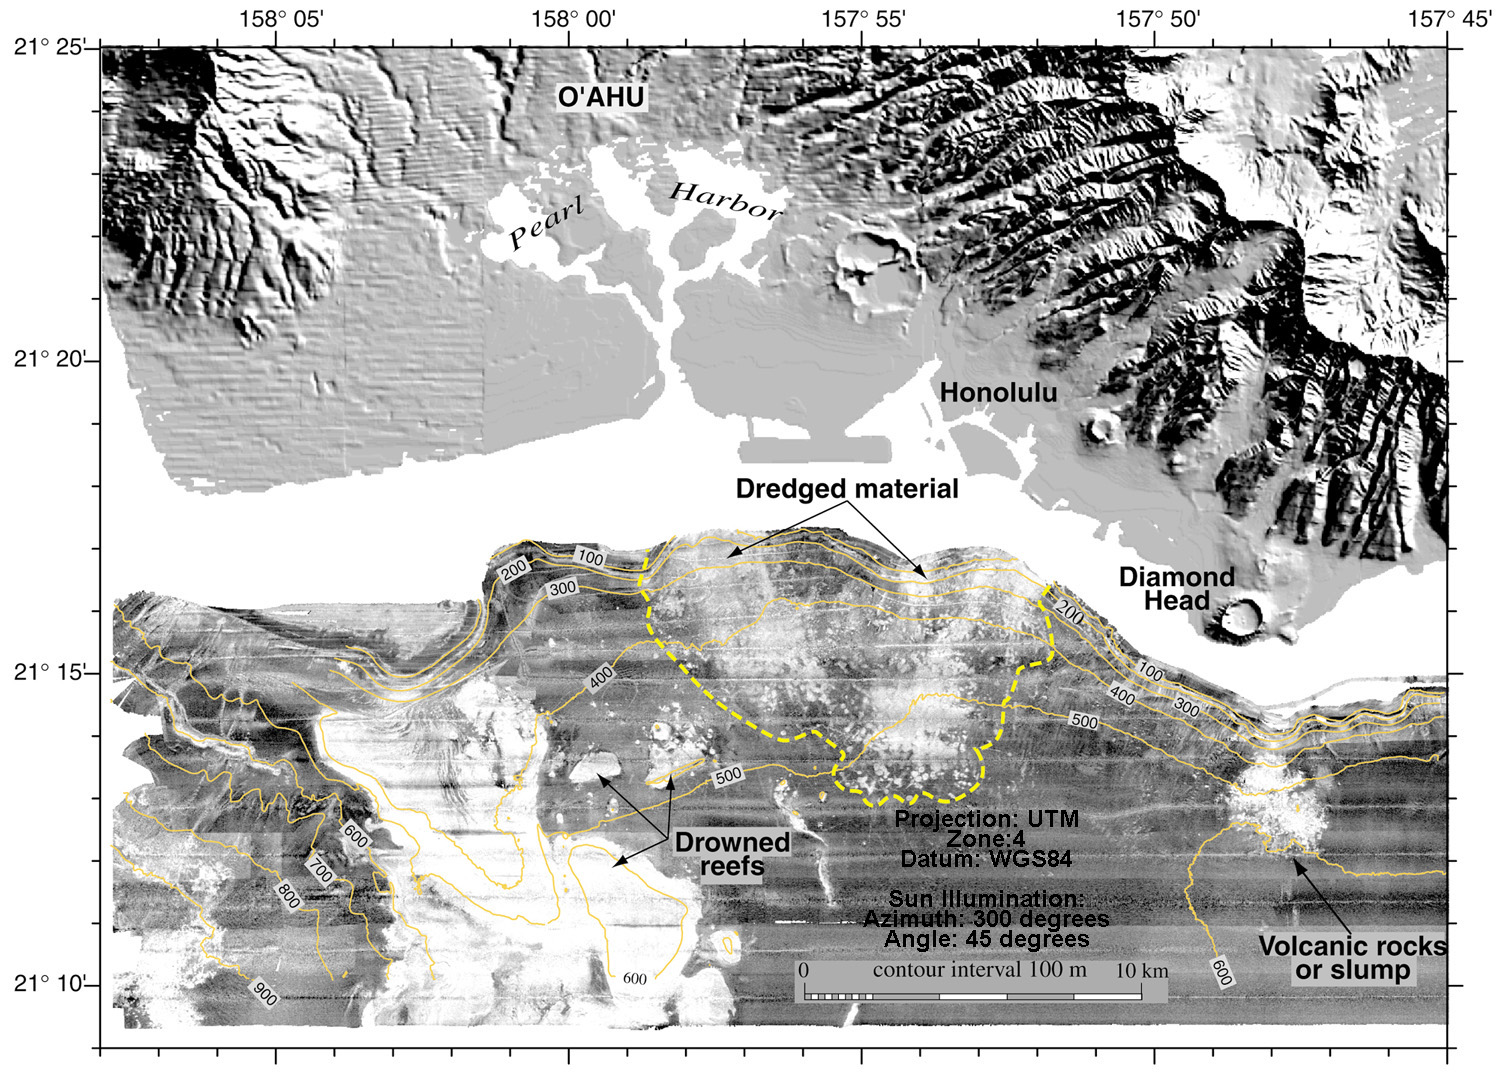
Figure 12 |
Note the high backscatter (bright tones) dredged-material deposits, drowned reefs and volcanic or slump features. Natural sandy sediment is characterized by low-backscatter (dark tones). Sun illumination for land: azimuth 345 degrees; angle 45 degrees. Compare to Plate 4. |
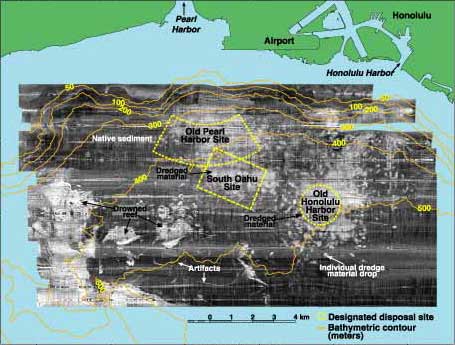
Figure 13 |
Compare to Figure 12. Disposal sites and dredged material deposits appear as isolated circular high-backscatter features that coalesce to form a nearly continuous high-backscatter blanket. In both Figures 12 and 13, submerged reefs are characterized by high backscatter whereas natural sediment is characterized by low backscatter. Note that artifacts visible in the sidescan data are not present in multibeam map by comparing Figures 12 and 13. |
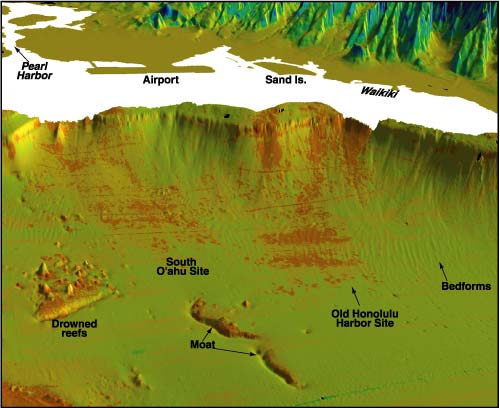
Figure 14 |
Dredged material deposits are high backscatter (red). Note the bedforms (sandwaves) that trend northwesterly across much of the seafloor. The bedforms are also visible on the multibeam imagery shown in Plate 4. The scale across the bottom of the image is about 9 km. Vertical exaggeration is 5x. |
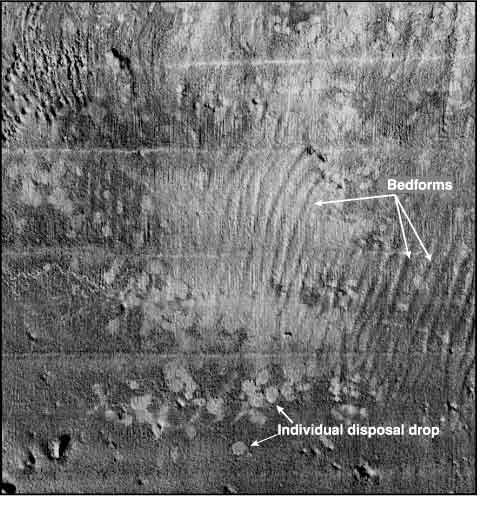
Figure 15 |
See Figures 12 and 13 for location of disposal site and compare to sidescan imagery in Figure 16. Multibeam image shows bedforms that are about 100-200 m in wave length and 1-3 m high, and other seafloor details that are not evident in the sidescan image seen in Figure 16. The scale across bottom of image is 5.6 km. |
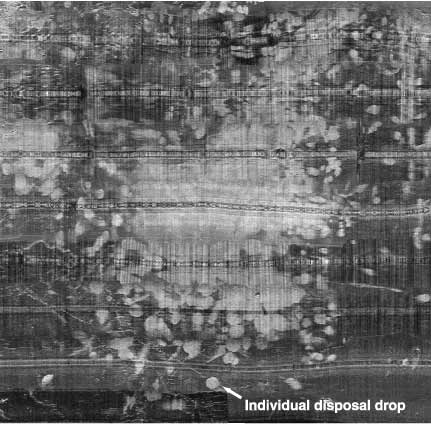
Figure 16 |
See Figures 12 and 13 for location of disposal site and compare to multibeam map in Figure 15. Note that the bedforms apparent in the multibeam maps are subtle at best in the sidescan data. In both data types the dredged material deposits appear as isolated high-backscatter circular features that coalesce to form a nearly continuous high-backscatter blanket. When compared to the multibeam image (Figure 15) the sidescan appears to resolve the boundaries of individual circular high-backscatter features better than the multibeam data. Scale across the bottom of the image is 5.5 km. |
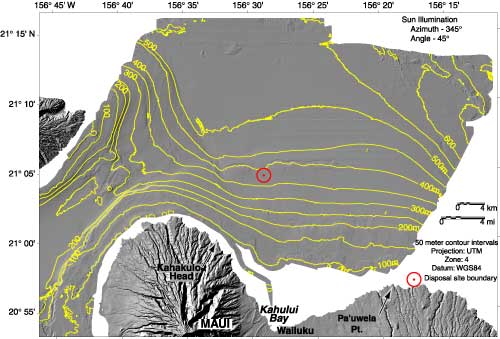
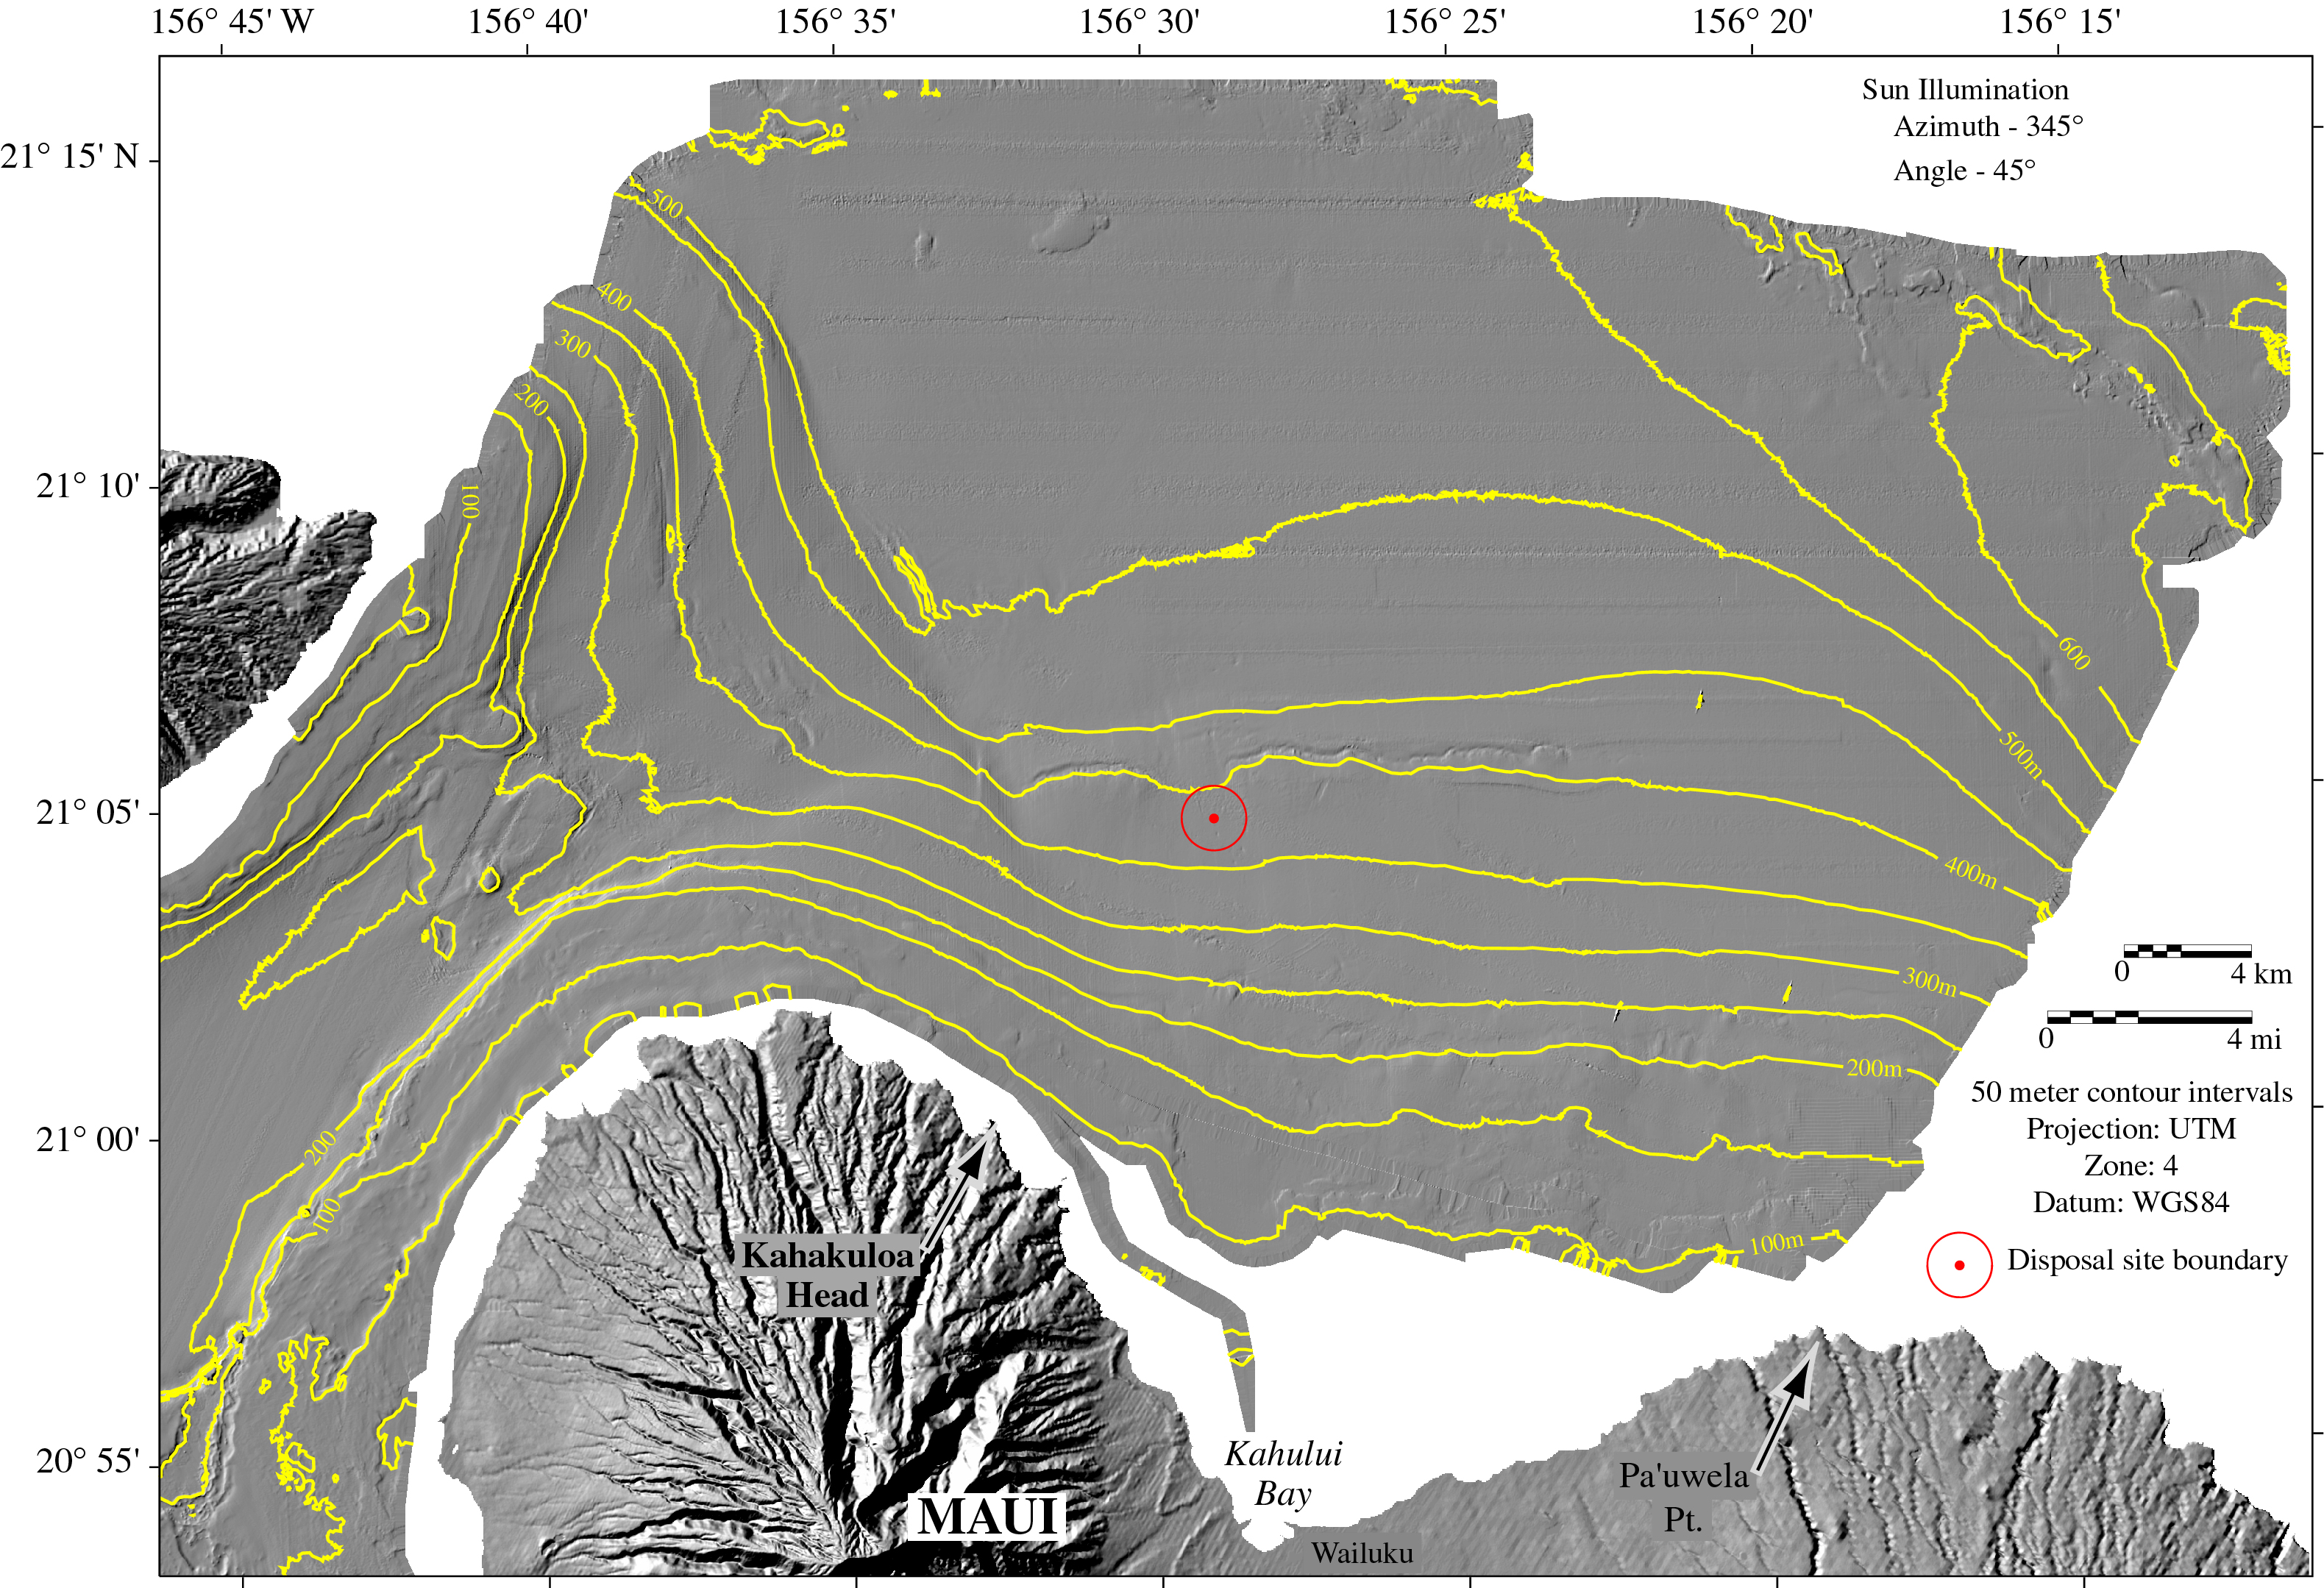
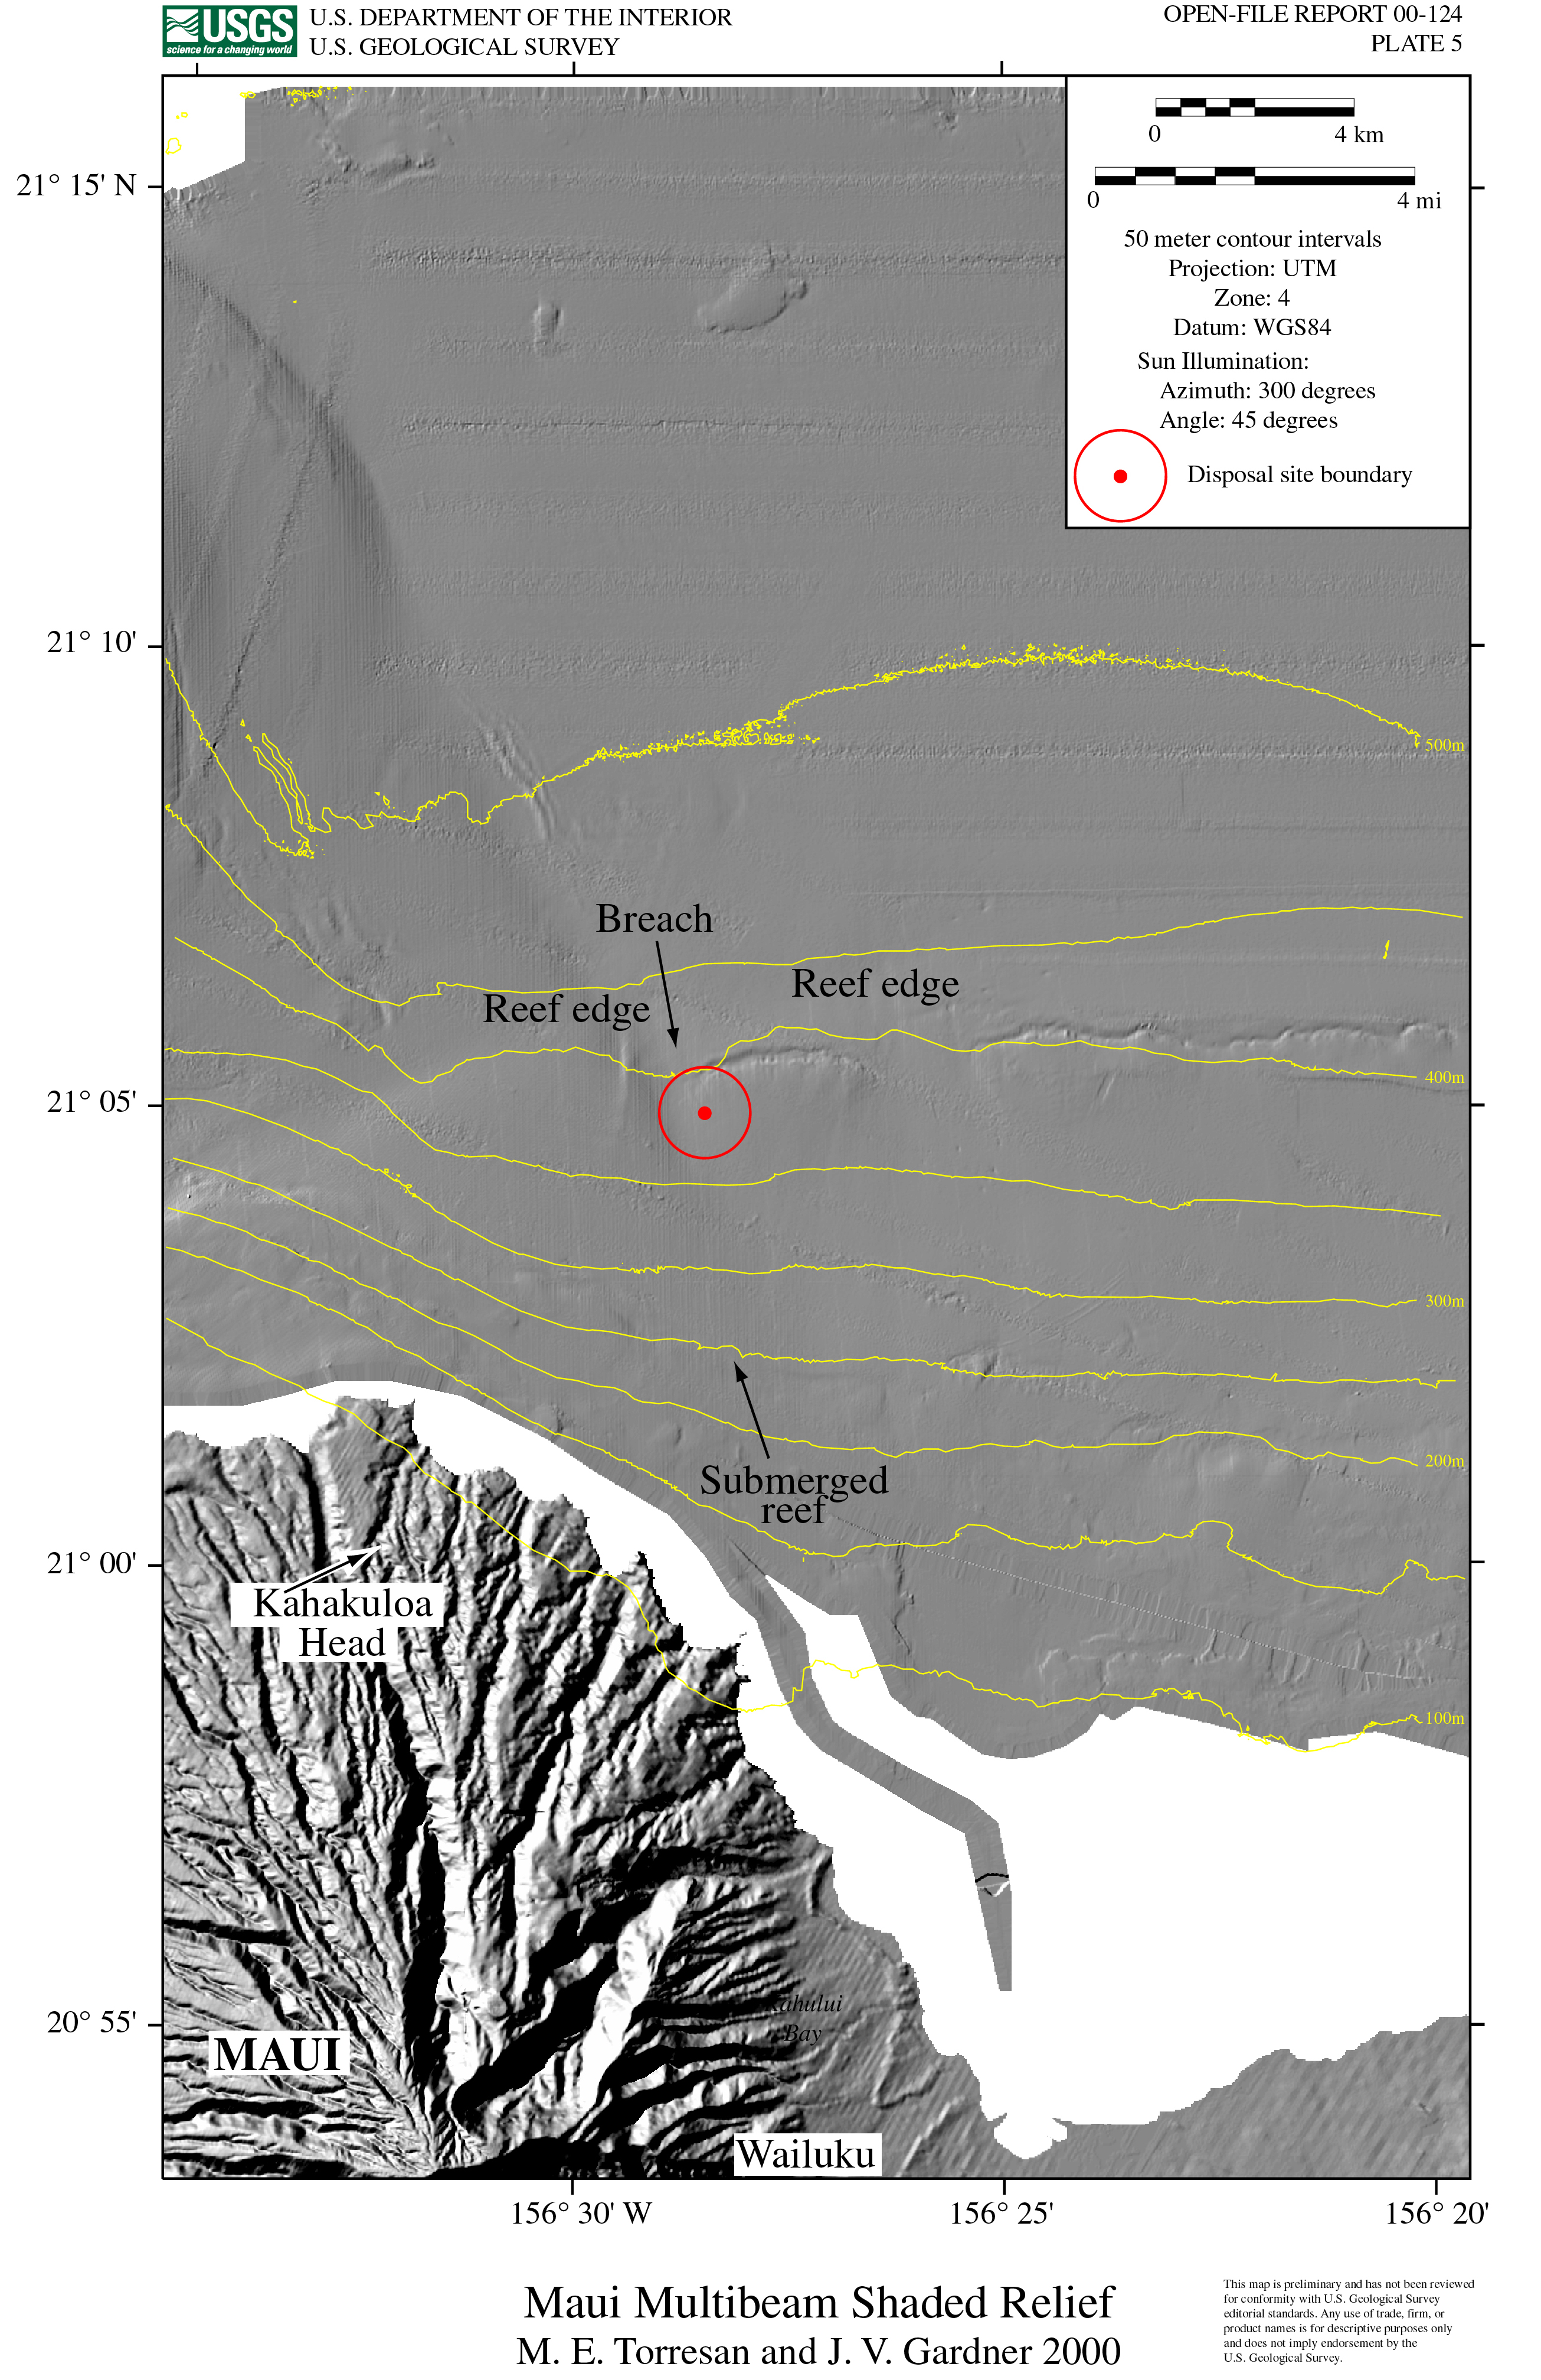
Figure 17 |
The Kahului dredged material disposal site is located inshore (south) of a breach in a submerged 400-m reef. See Plate 5 for details of the submarine topography and compare to the backscatter maps shown in Figure 18 and Plate 6. Shoaling from disposal activities is not evident on the multibeam data. Sun Illumination: Azimuth: 345 degrees; Angle 45 degrees. |
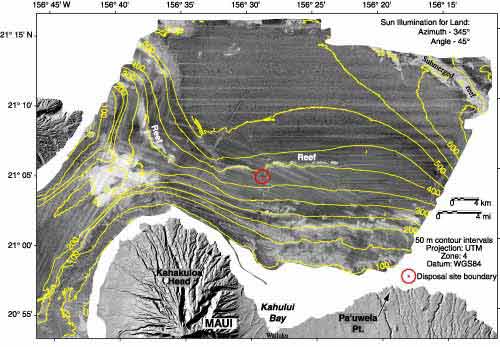
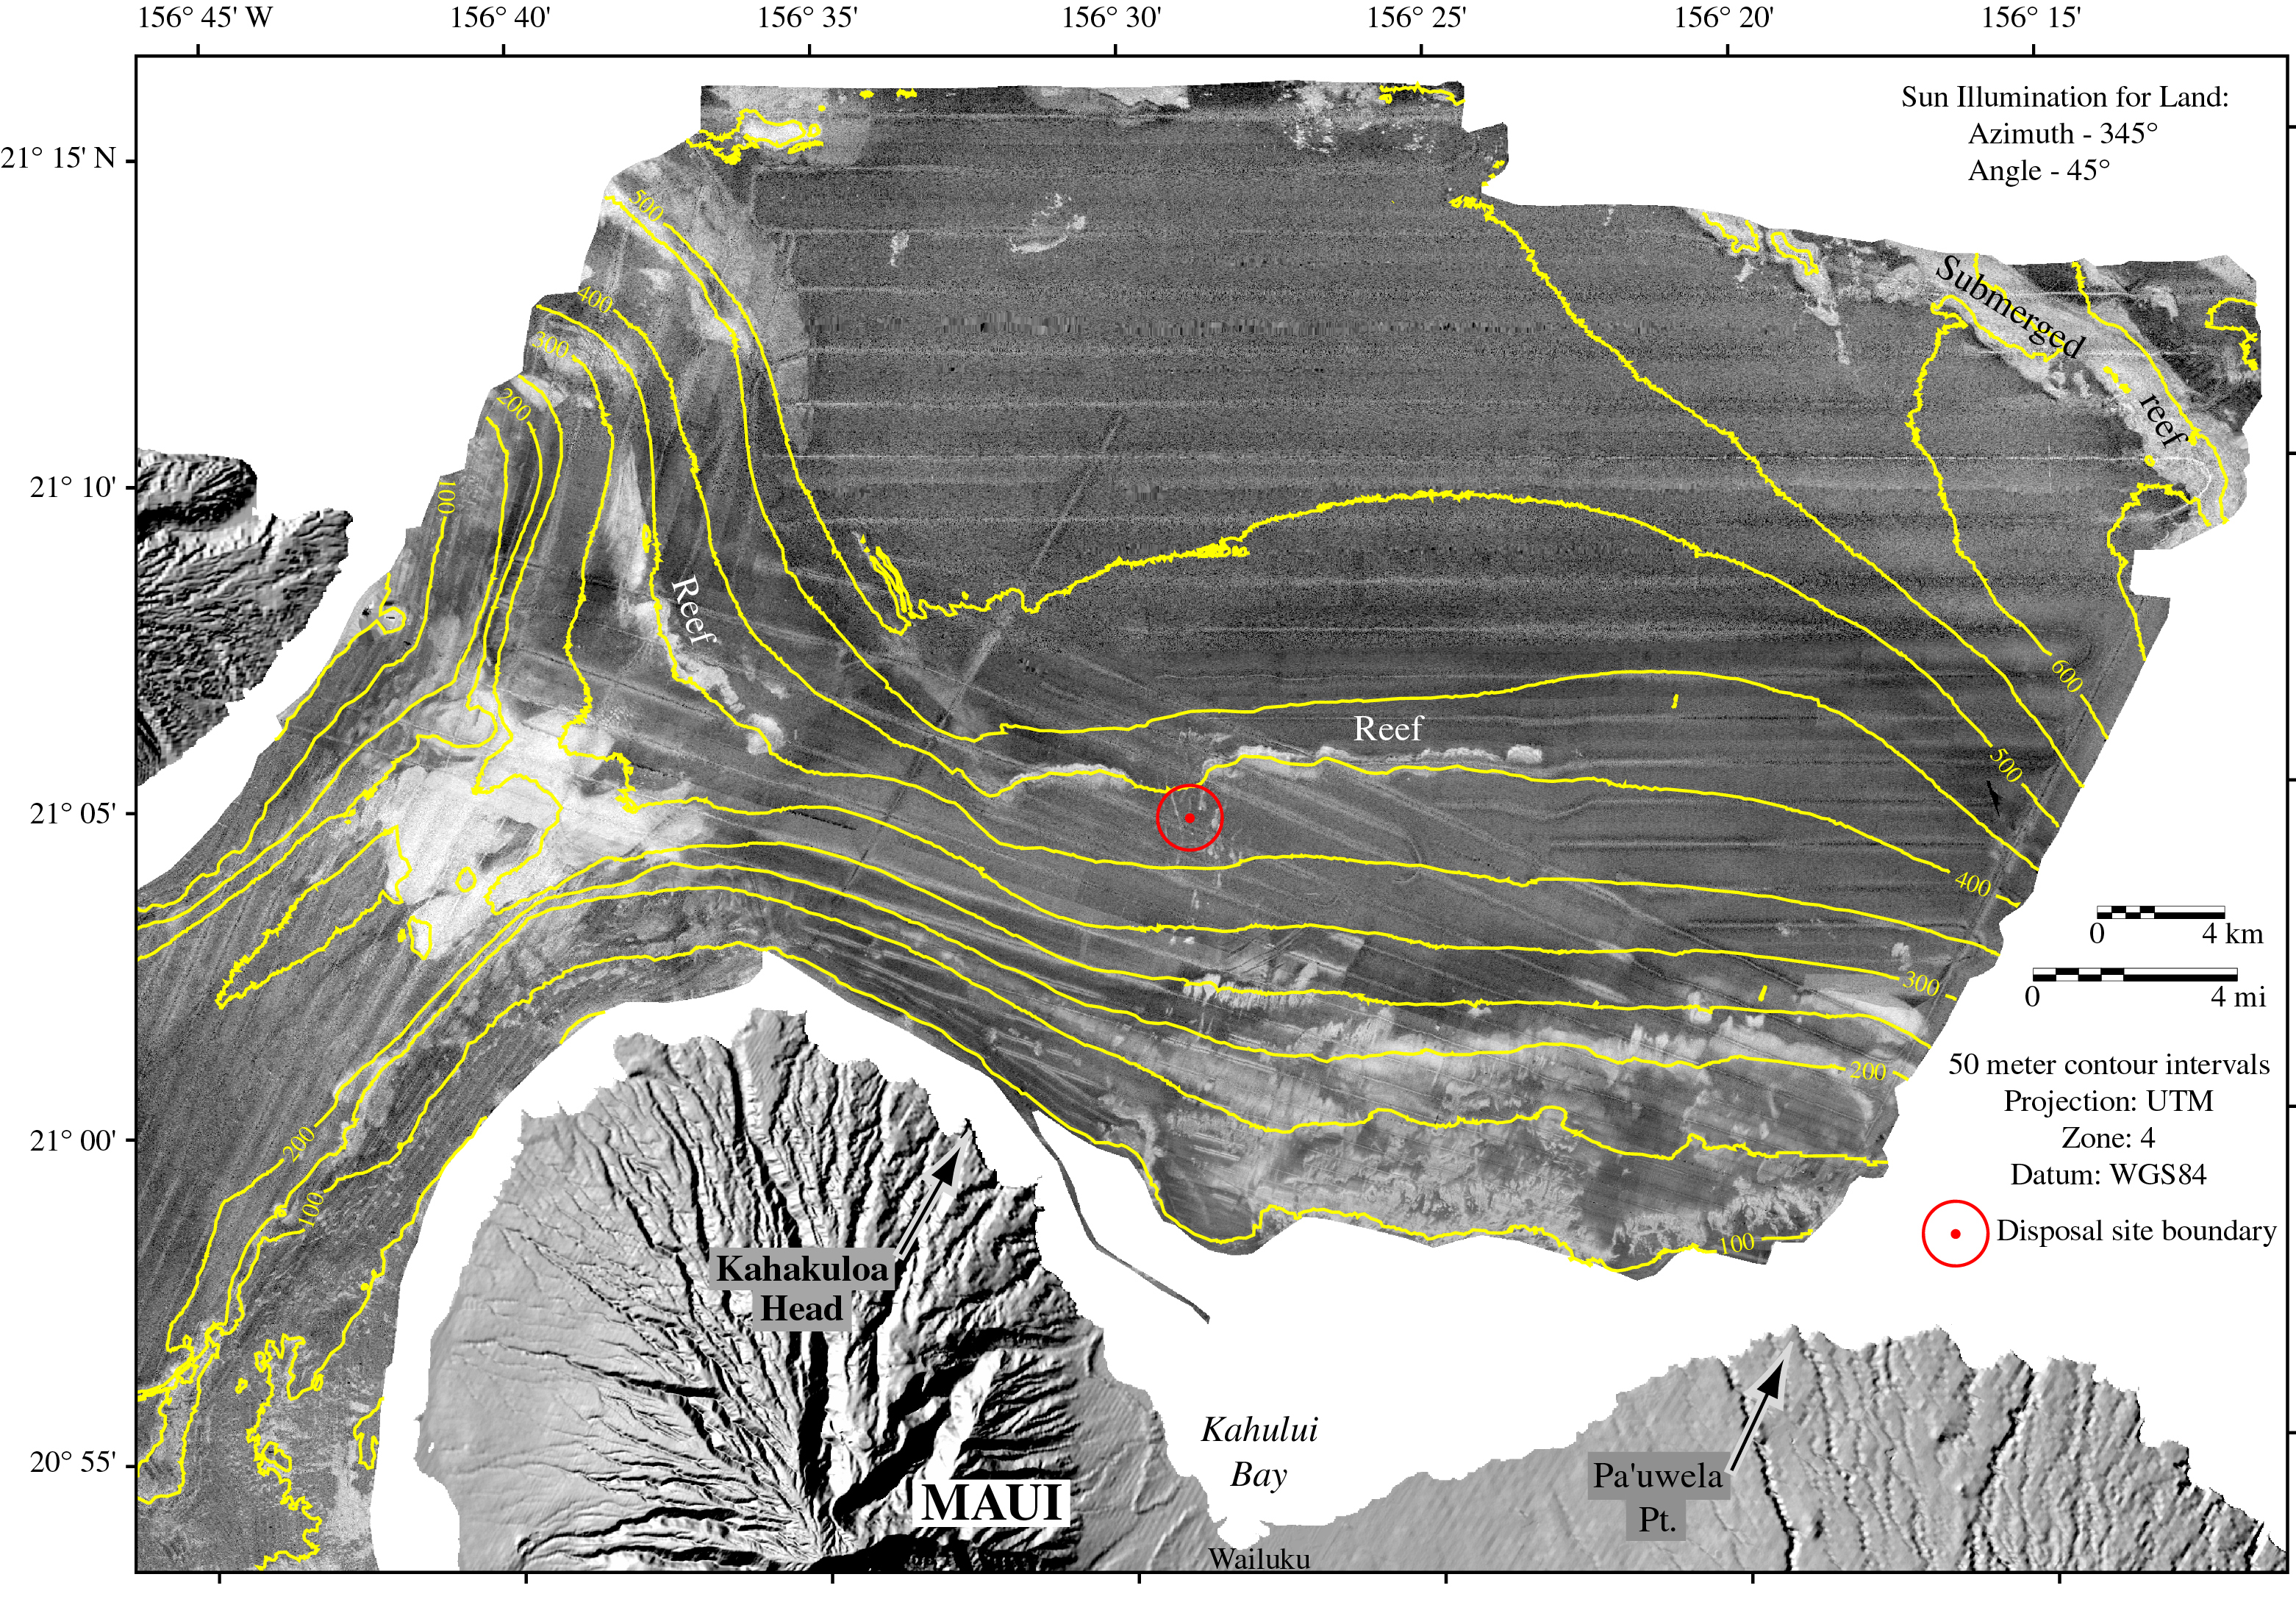
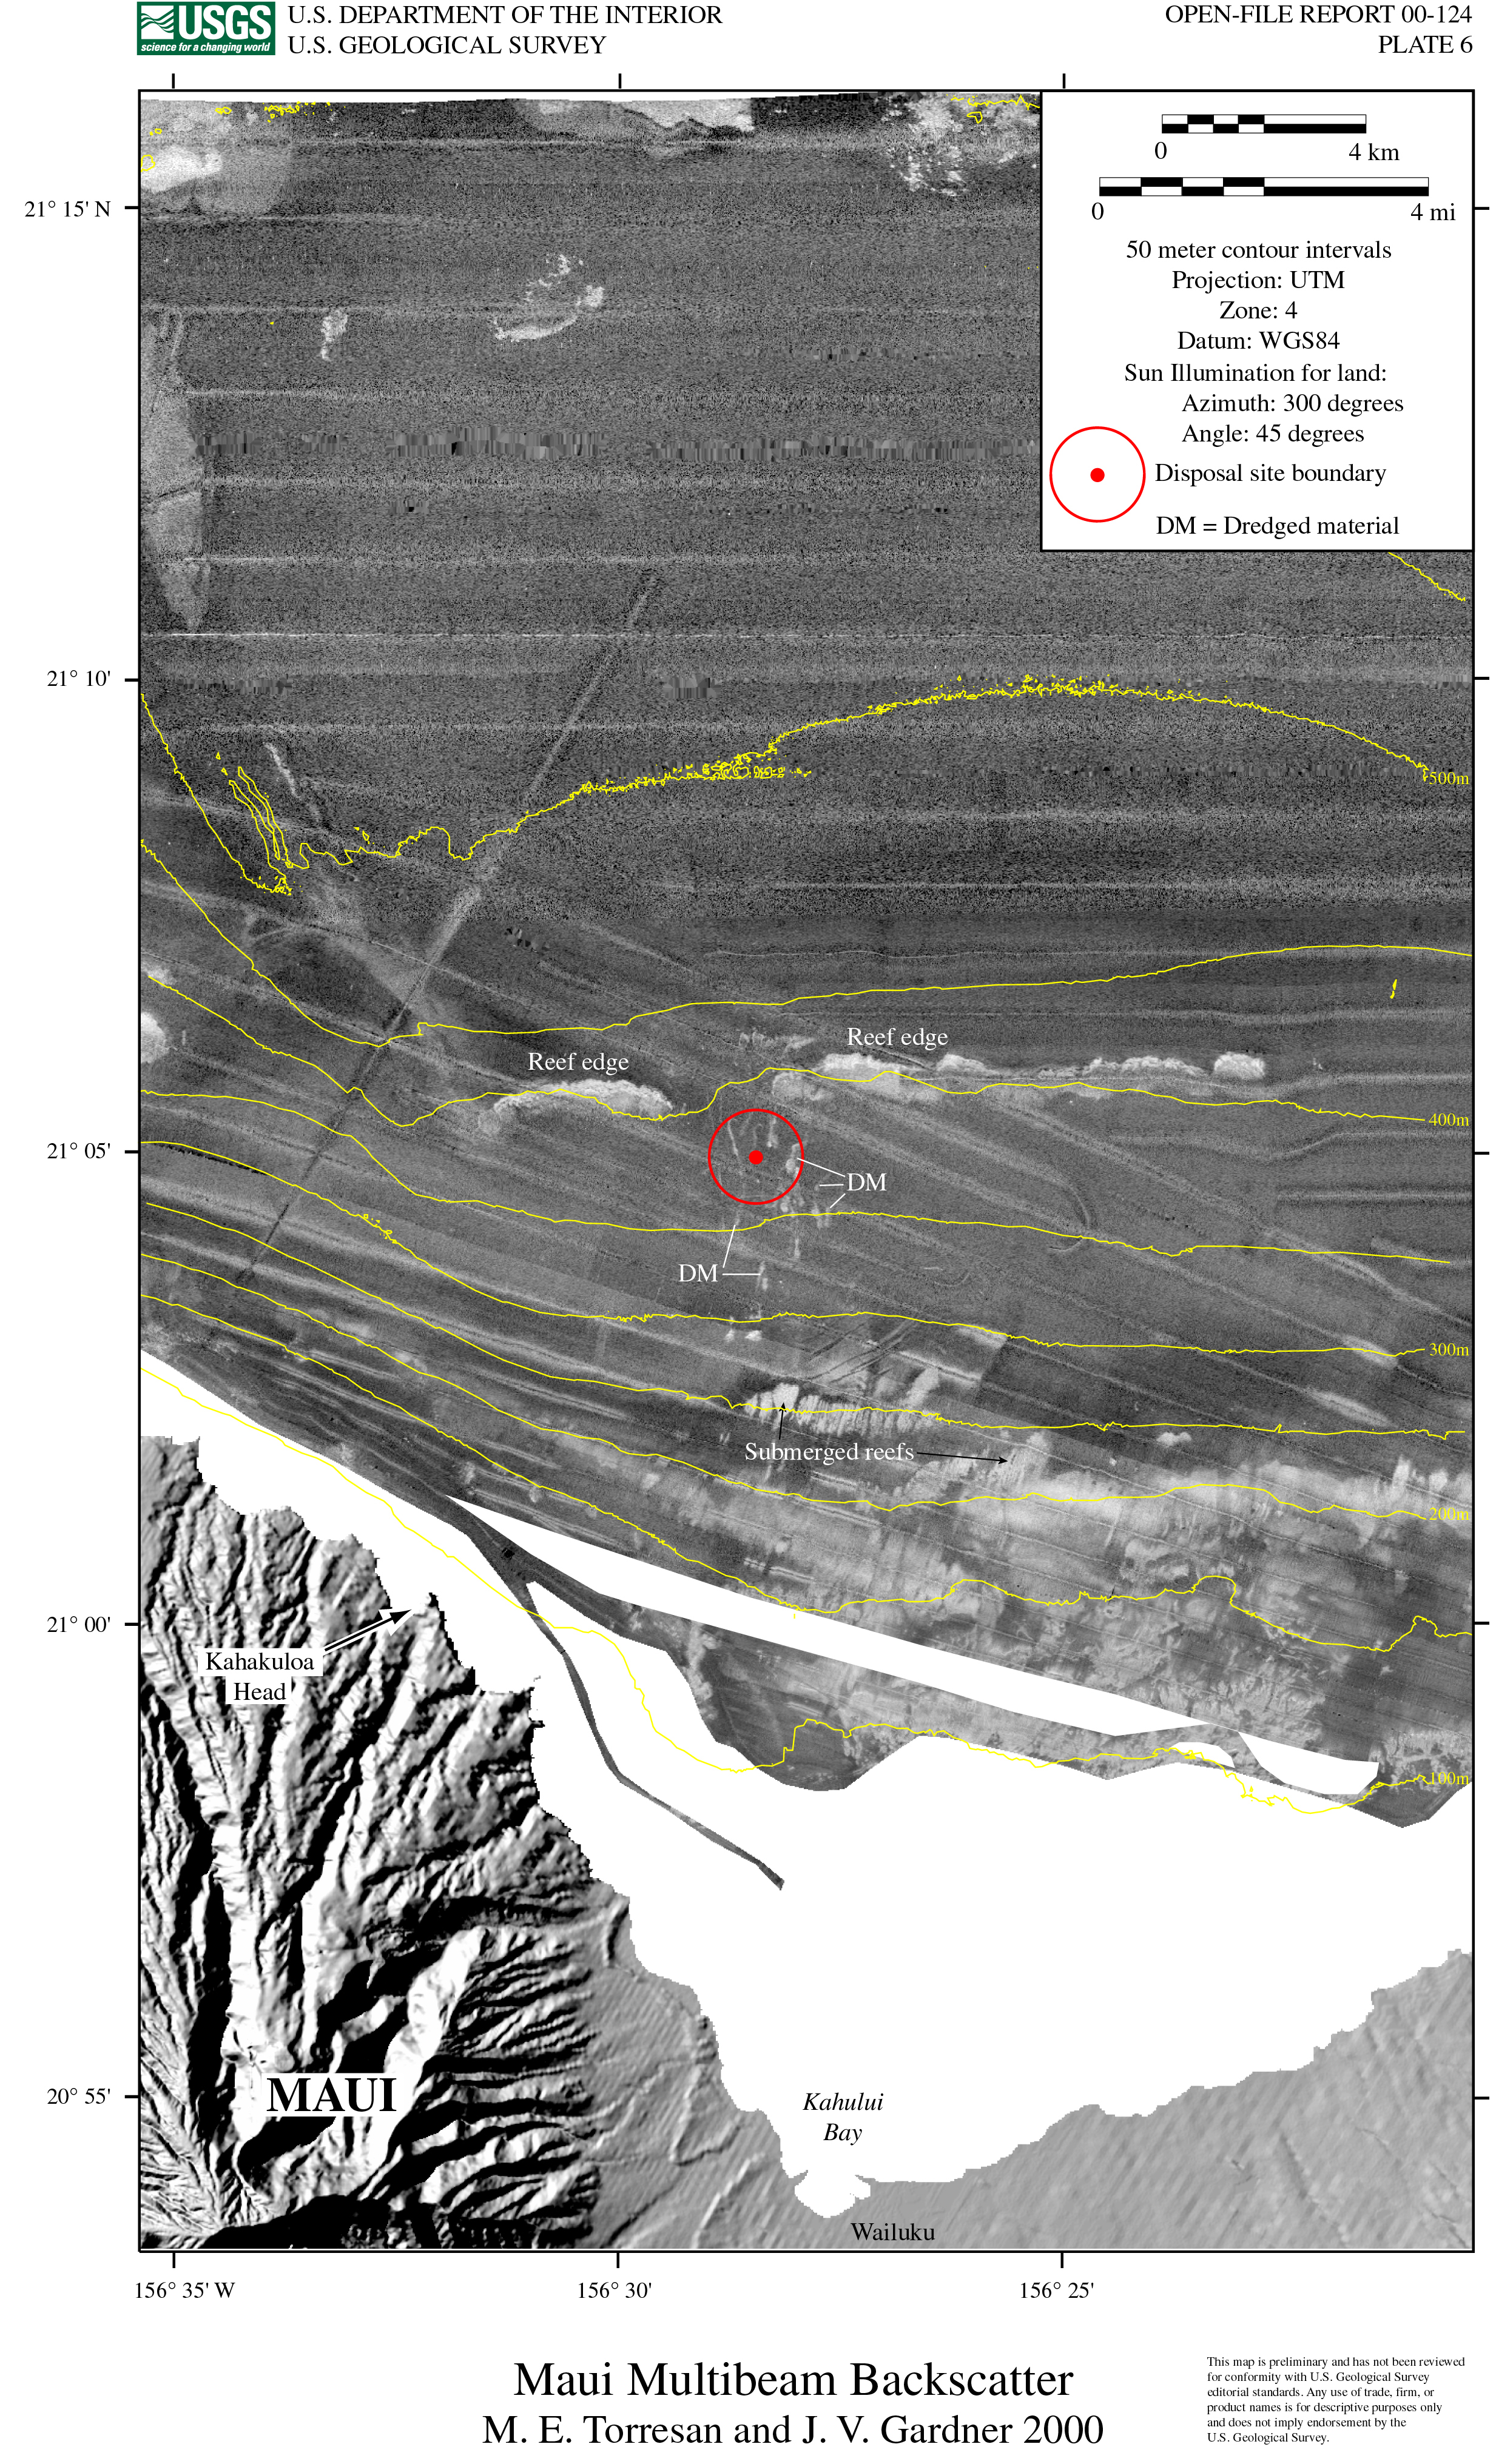
Figure 18 |
The Kahului dredged material disposal site is located inshore (south) of a breach in the submerged, high-backscatter reef. Compare to Plates 5 and 6 and Figures 19 and 20 for details of the submarine topography. Note the sparse nature of the high-backscatter dredged material and the occurence of high-backscatter submerged reefs that were formed during ancient low-stands of sea level. Sun Illumination for land: azimuth 345 degrees; angle 45 degrees. |
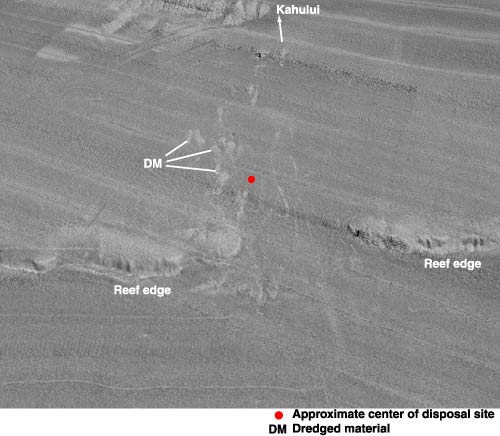
Figure 19 |
Note the sparse nature of the high-backscatter dredged material deposit. Compare to Figures 17 and 19, and to Plate 6. Scale across the bottom of the image is about 10 km. Vertical exaggeration is 3x. |
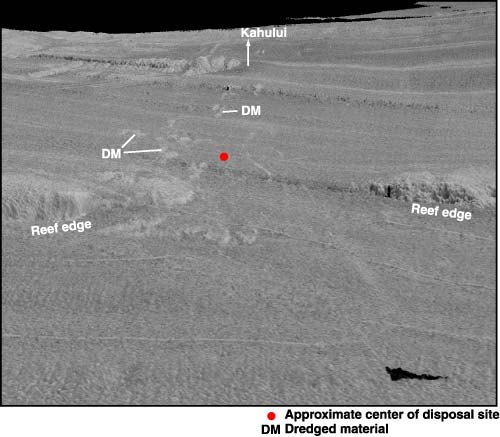
Figure 20 |
Note the sparse nature of the high-backscatter dredged material deposit compared to the Mamala Bay sites. The scale across the bottom of the image is about 6.5 km. Vertical exaggeration is 3x. |
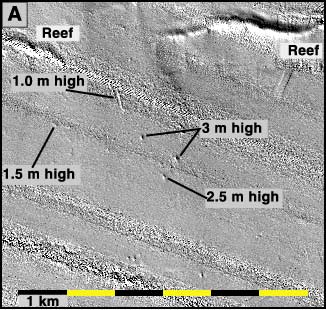
Figure 21 (A) |
Shaded-relief map of Kahului Disposal site |
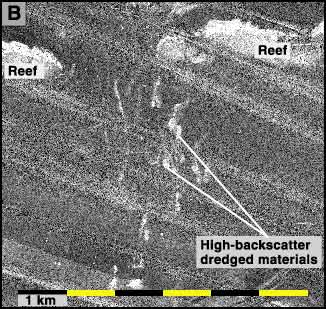
Figure 21 (B) |
Backscatter map of Kahului Disposal Site.
Note that some of the high-backscatter features shown in 21B are mounds with a relief of 1 - 3 m. |
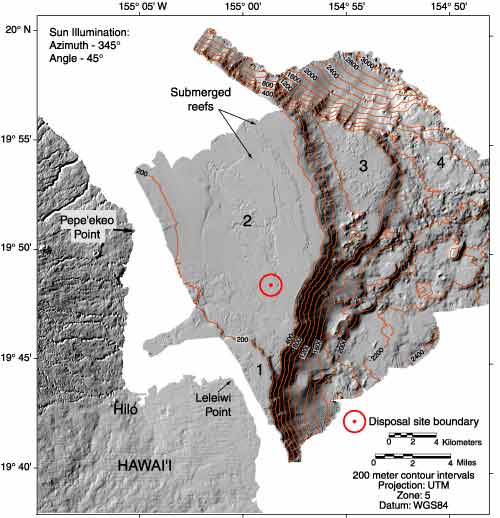
Figure 22 |
Compare to Plates 7 and 8 for details of seafloor morphology. Note the four numbered submerged terraces that compose this portion of the Hilo Ridge. The terraces were formed during ancient low-stands of sea level. Sun illumination: azimuth 345 degrees; angle 45 degrees. |
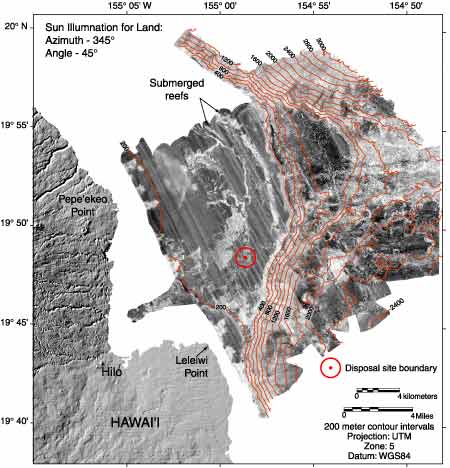
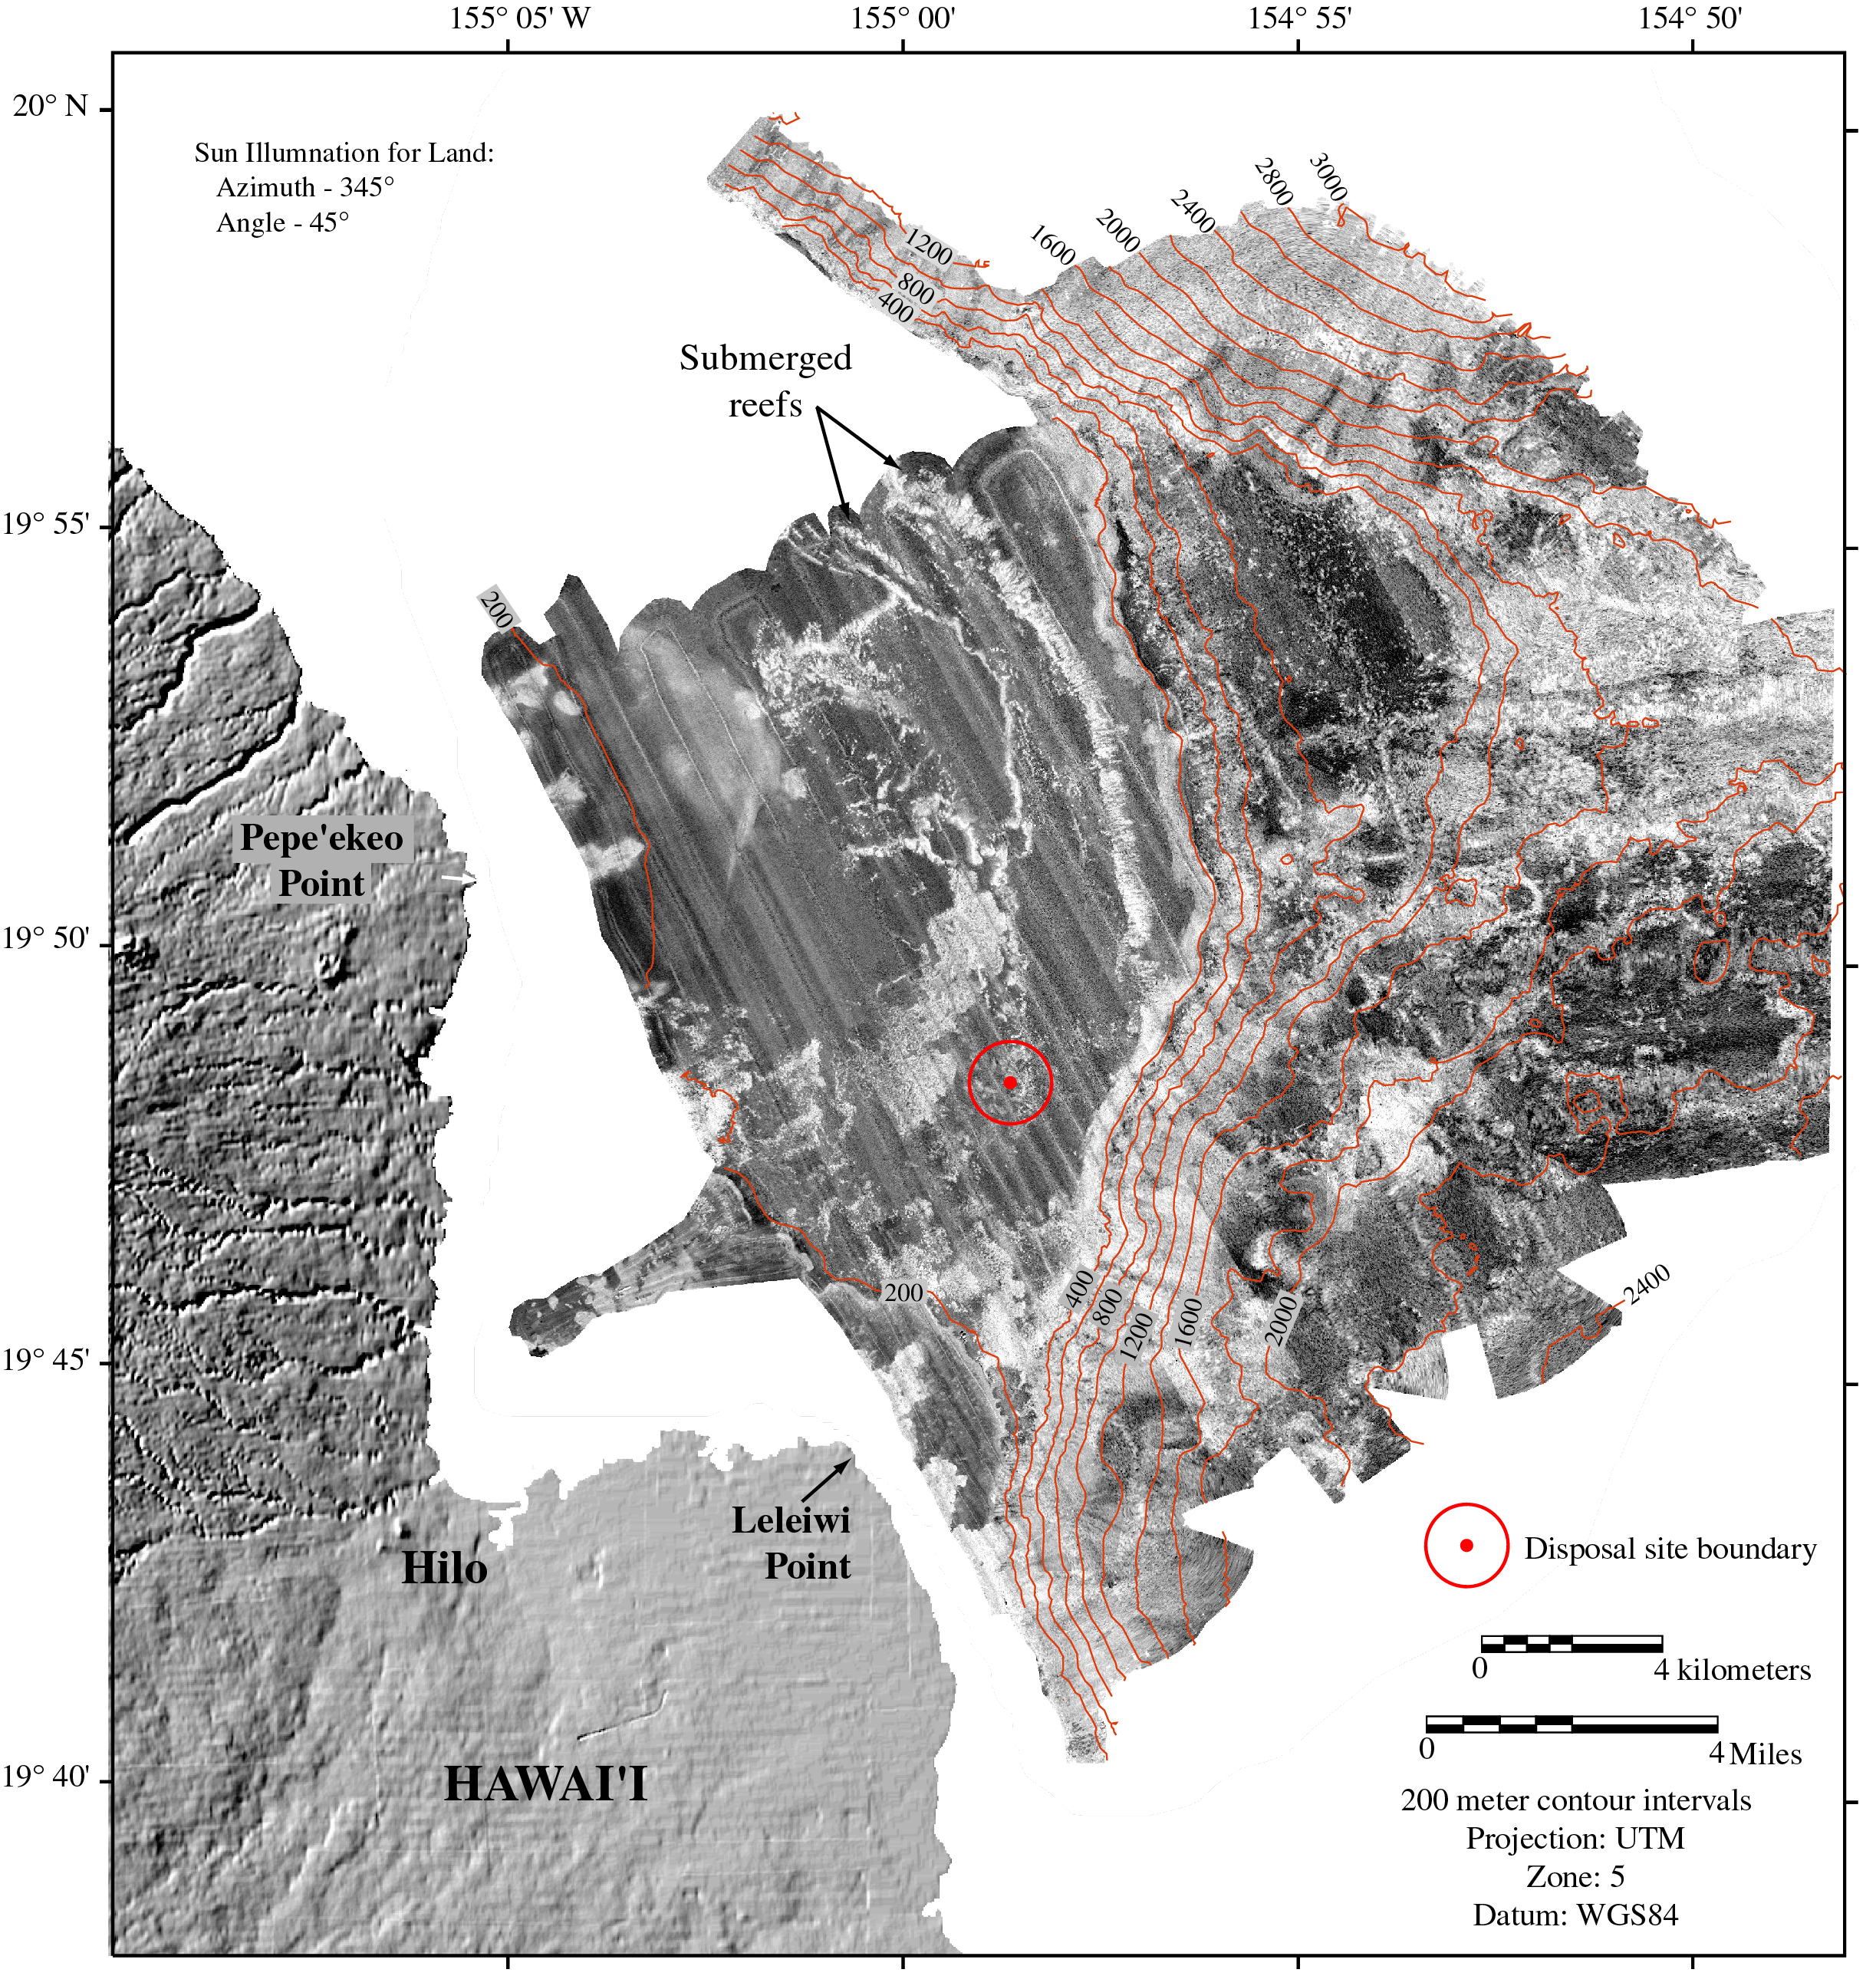
Figure 23 |
Compare to Plates 7 and 8 for details of seafloor morphology. Note the high-backscatter submerged reef and terrace outer edges. A high-backscatter lava flow is visible north and west of the disposal site. Compare to Figures 24, 25, 26, 27, and 28. Sun Illumination for land: azimuth 345 degrees; angle 45 degrees. |
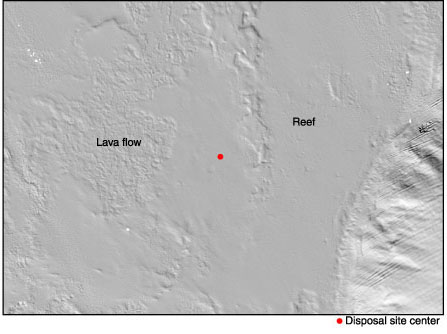
Figure 24 |
Scale across the bottom of this image is about 8 km |
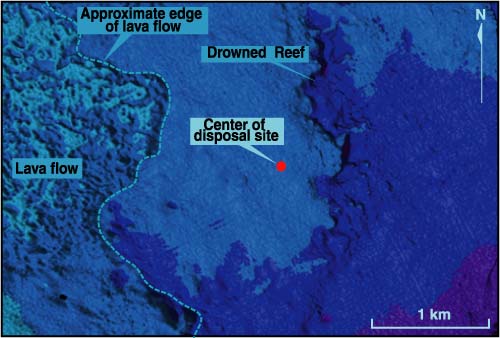
Figure 25 |
Light blue area is less than 340 m deep. Medium blue area is between 340 and 350 m deep. Dark blue area is between 350 and 360 m deep. Purple area is over 360 m deep. |
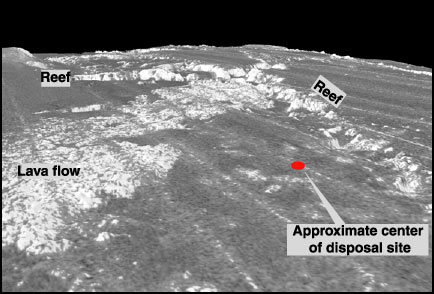
Figure 26 |
Backscatter has been draped over shaded-relief data. The site is located between a lava flow on the west and a reef on the east. Note the sparse nature of the high backscatter dredged material. Distance across the top of the image is about 8.6 km; across the bottom of the image is about 1.7 km. Depth of field is about 15 km. Vertical exaggeration is 6x. |
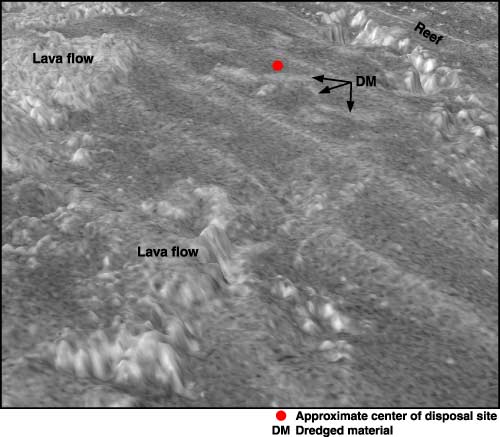
Figure 27 |
Backscatter data is draped over shaded-relief data. Site is located between lava flow to the west and reef edge to the east. Note the sparse nature of the high-backscatter dredged material deposit. The scale across the bottom on the image is about 3 km. Vertical exaggeration = 15x. |
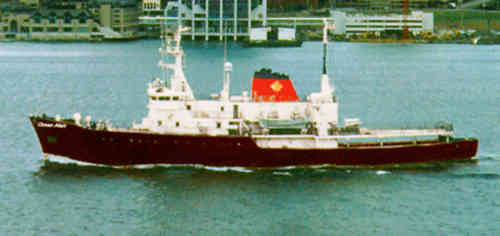
Figure 28 |
The R/V Ocean Alert |
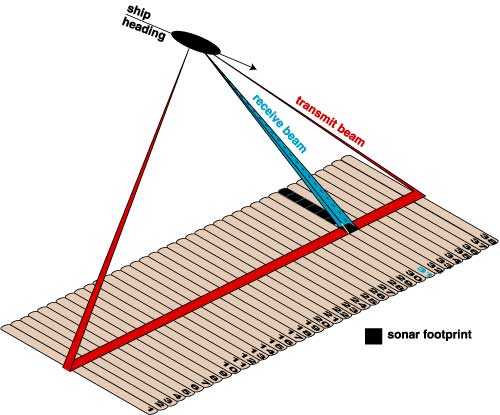
Figure 29 |
Schematic depicting transmit and receive cycles of multibeam system. |
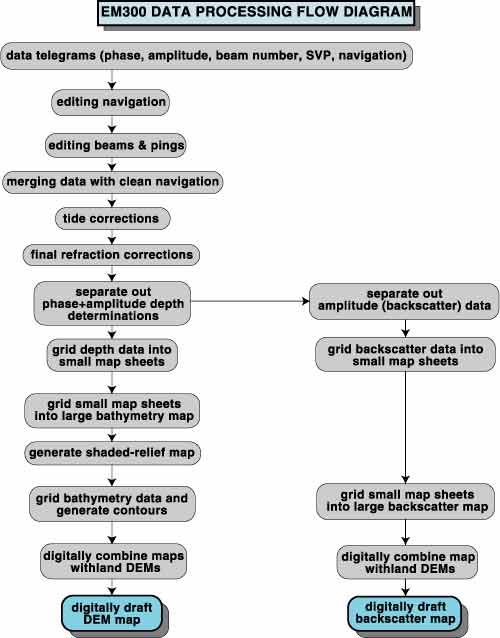
Figure 30 |
EM300 Data Processing Flow Diagram |


