Open-File Report 2000-0124
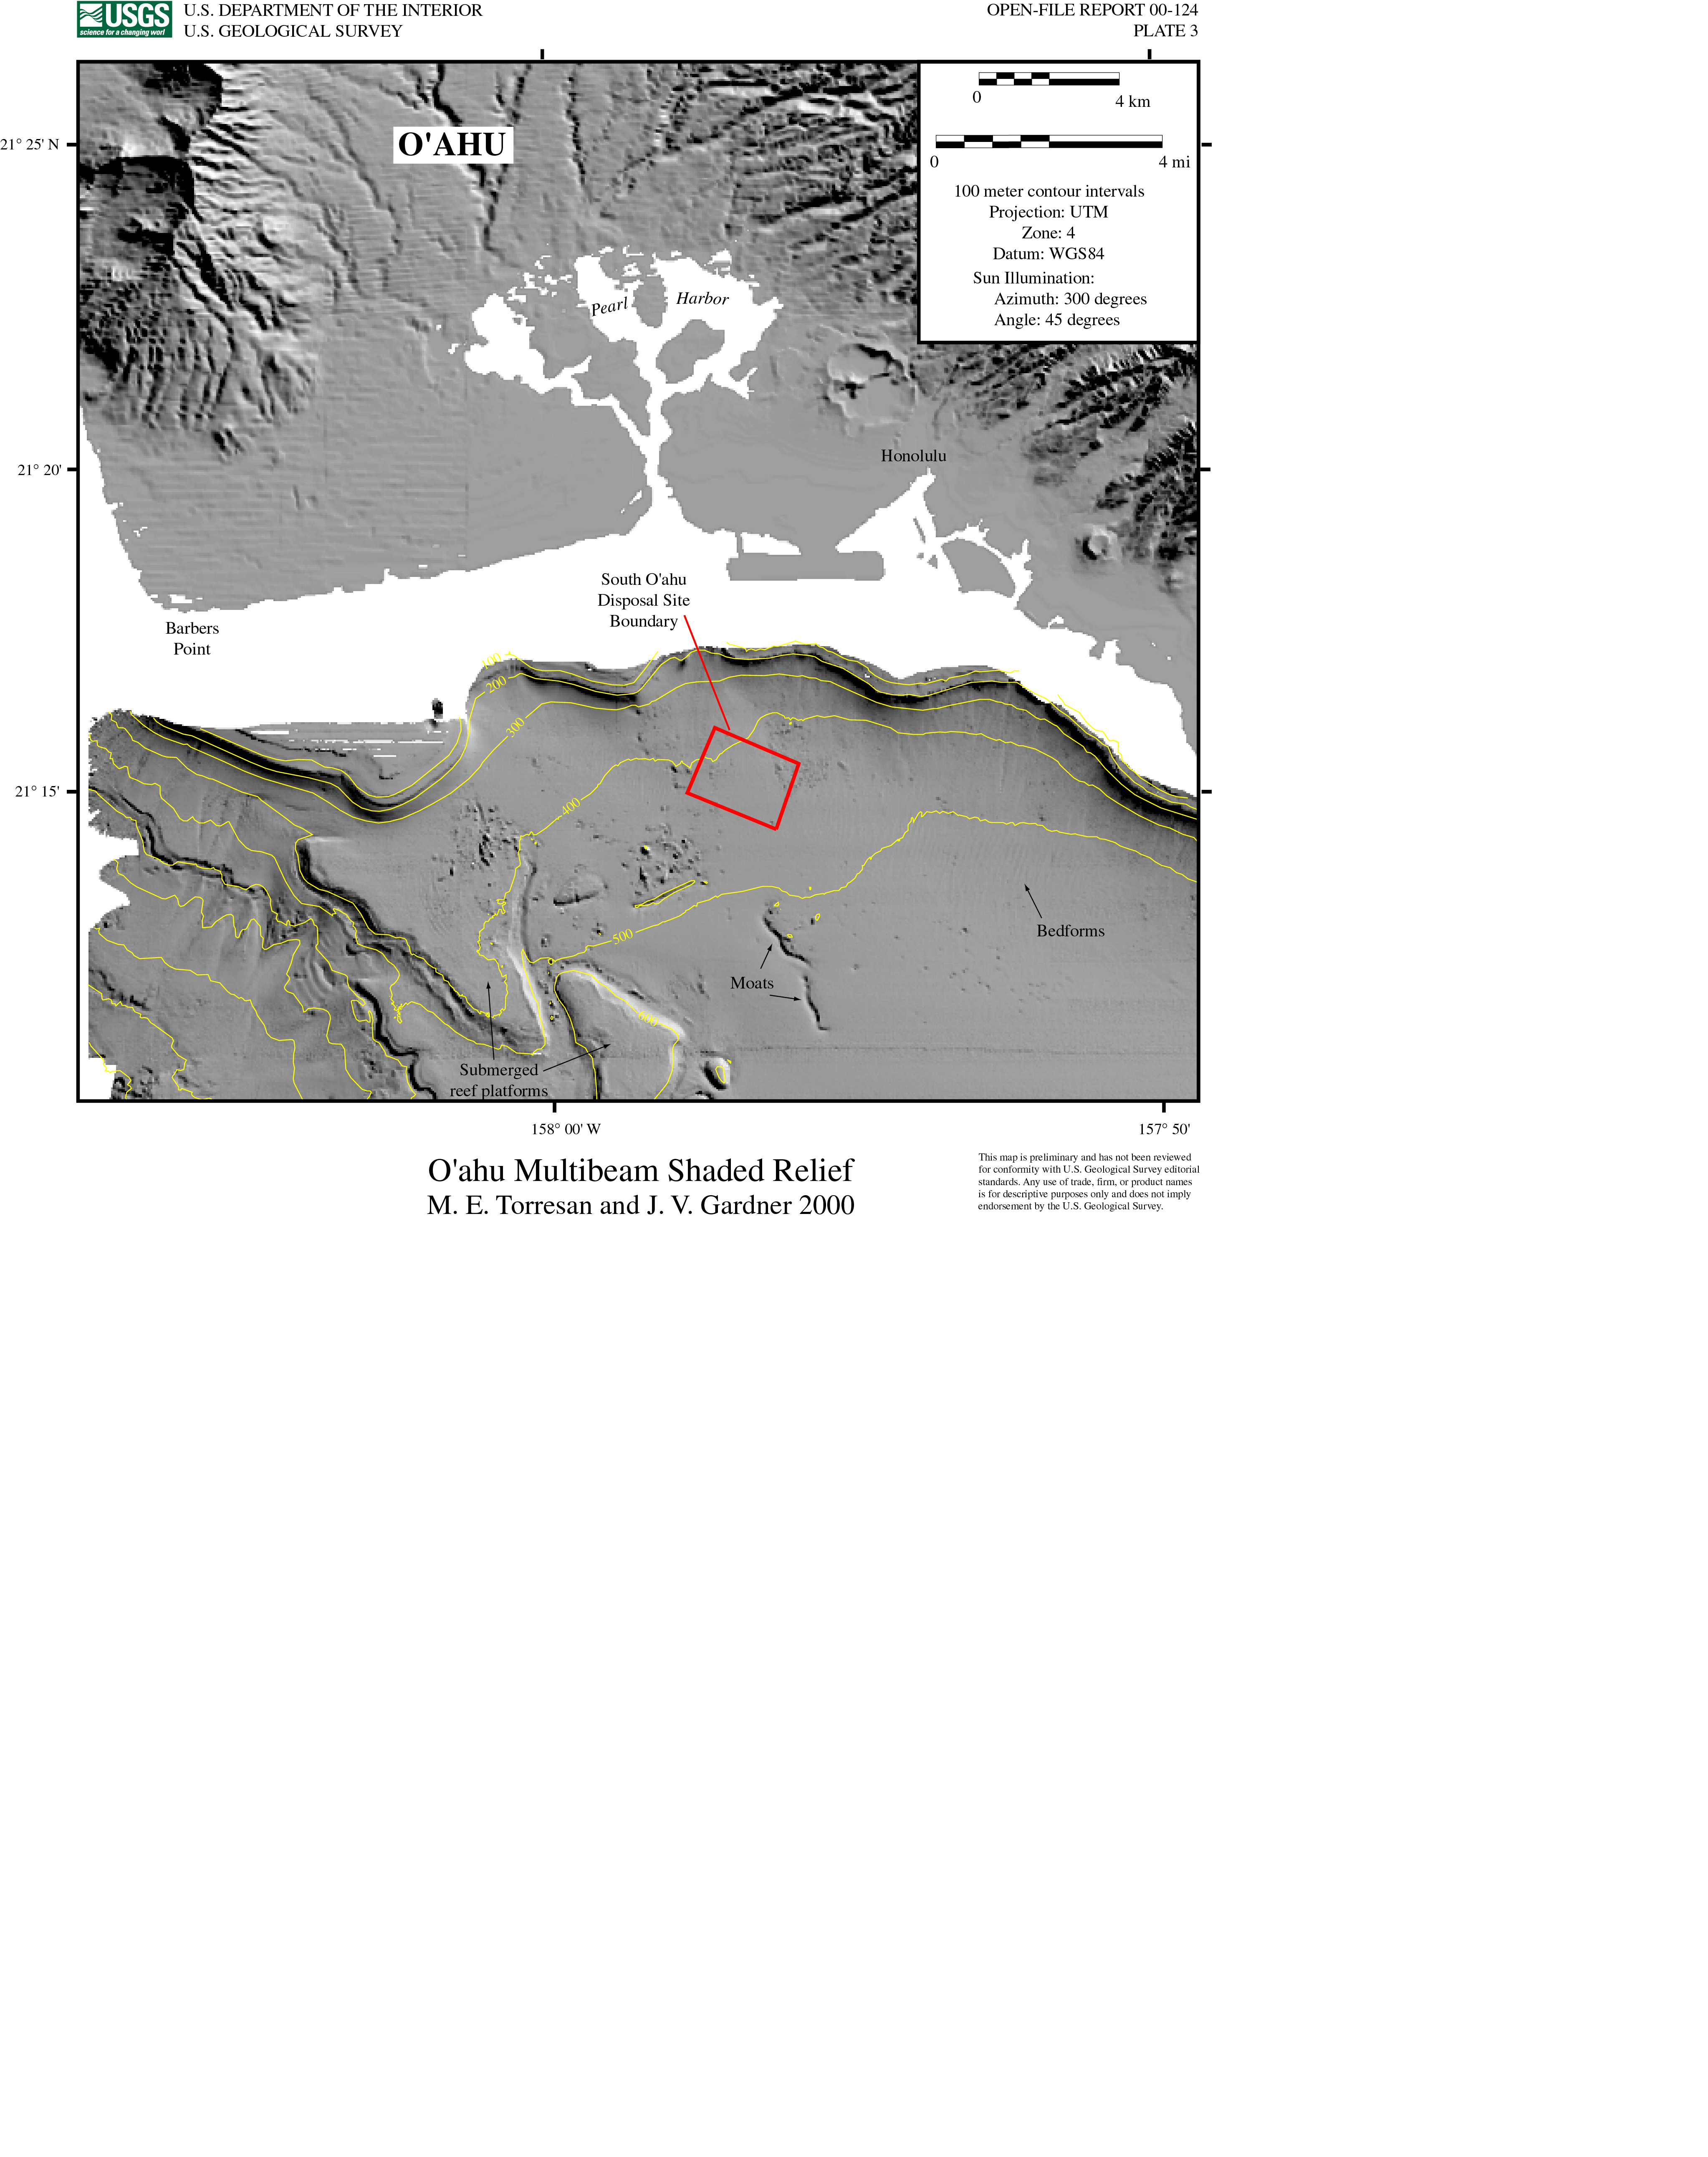
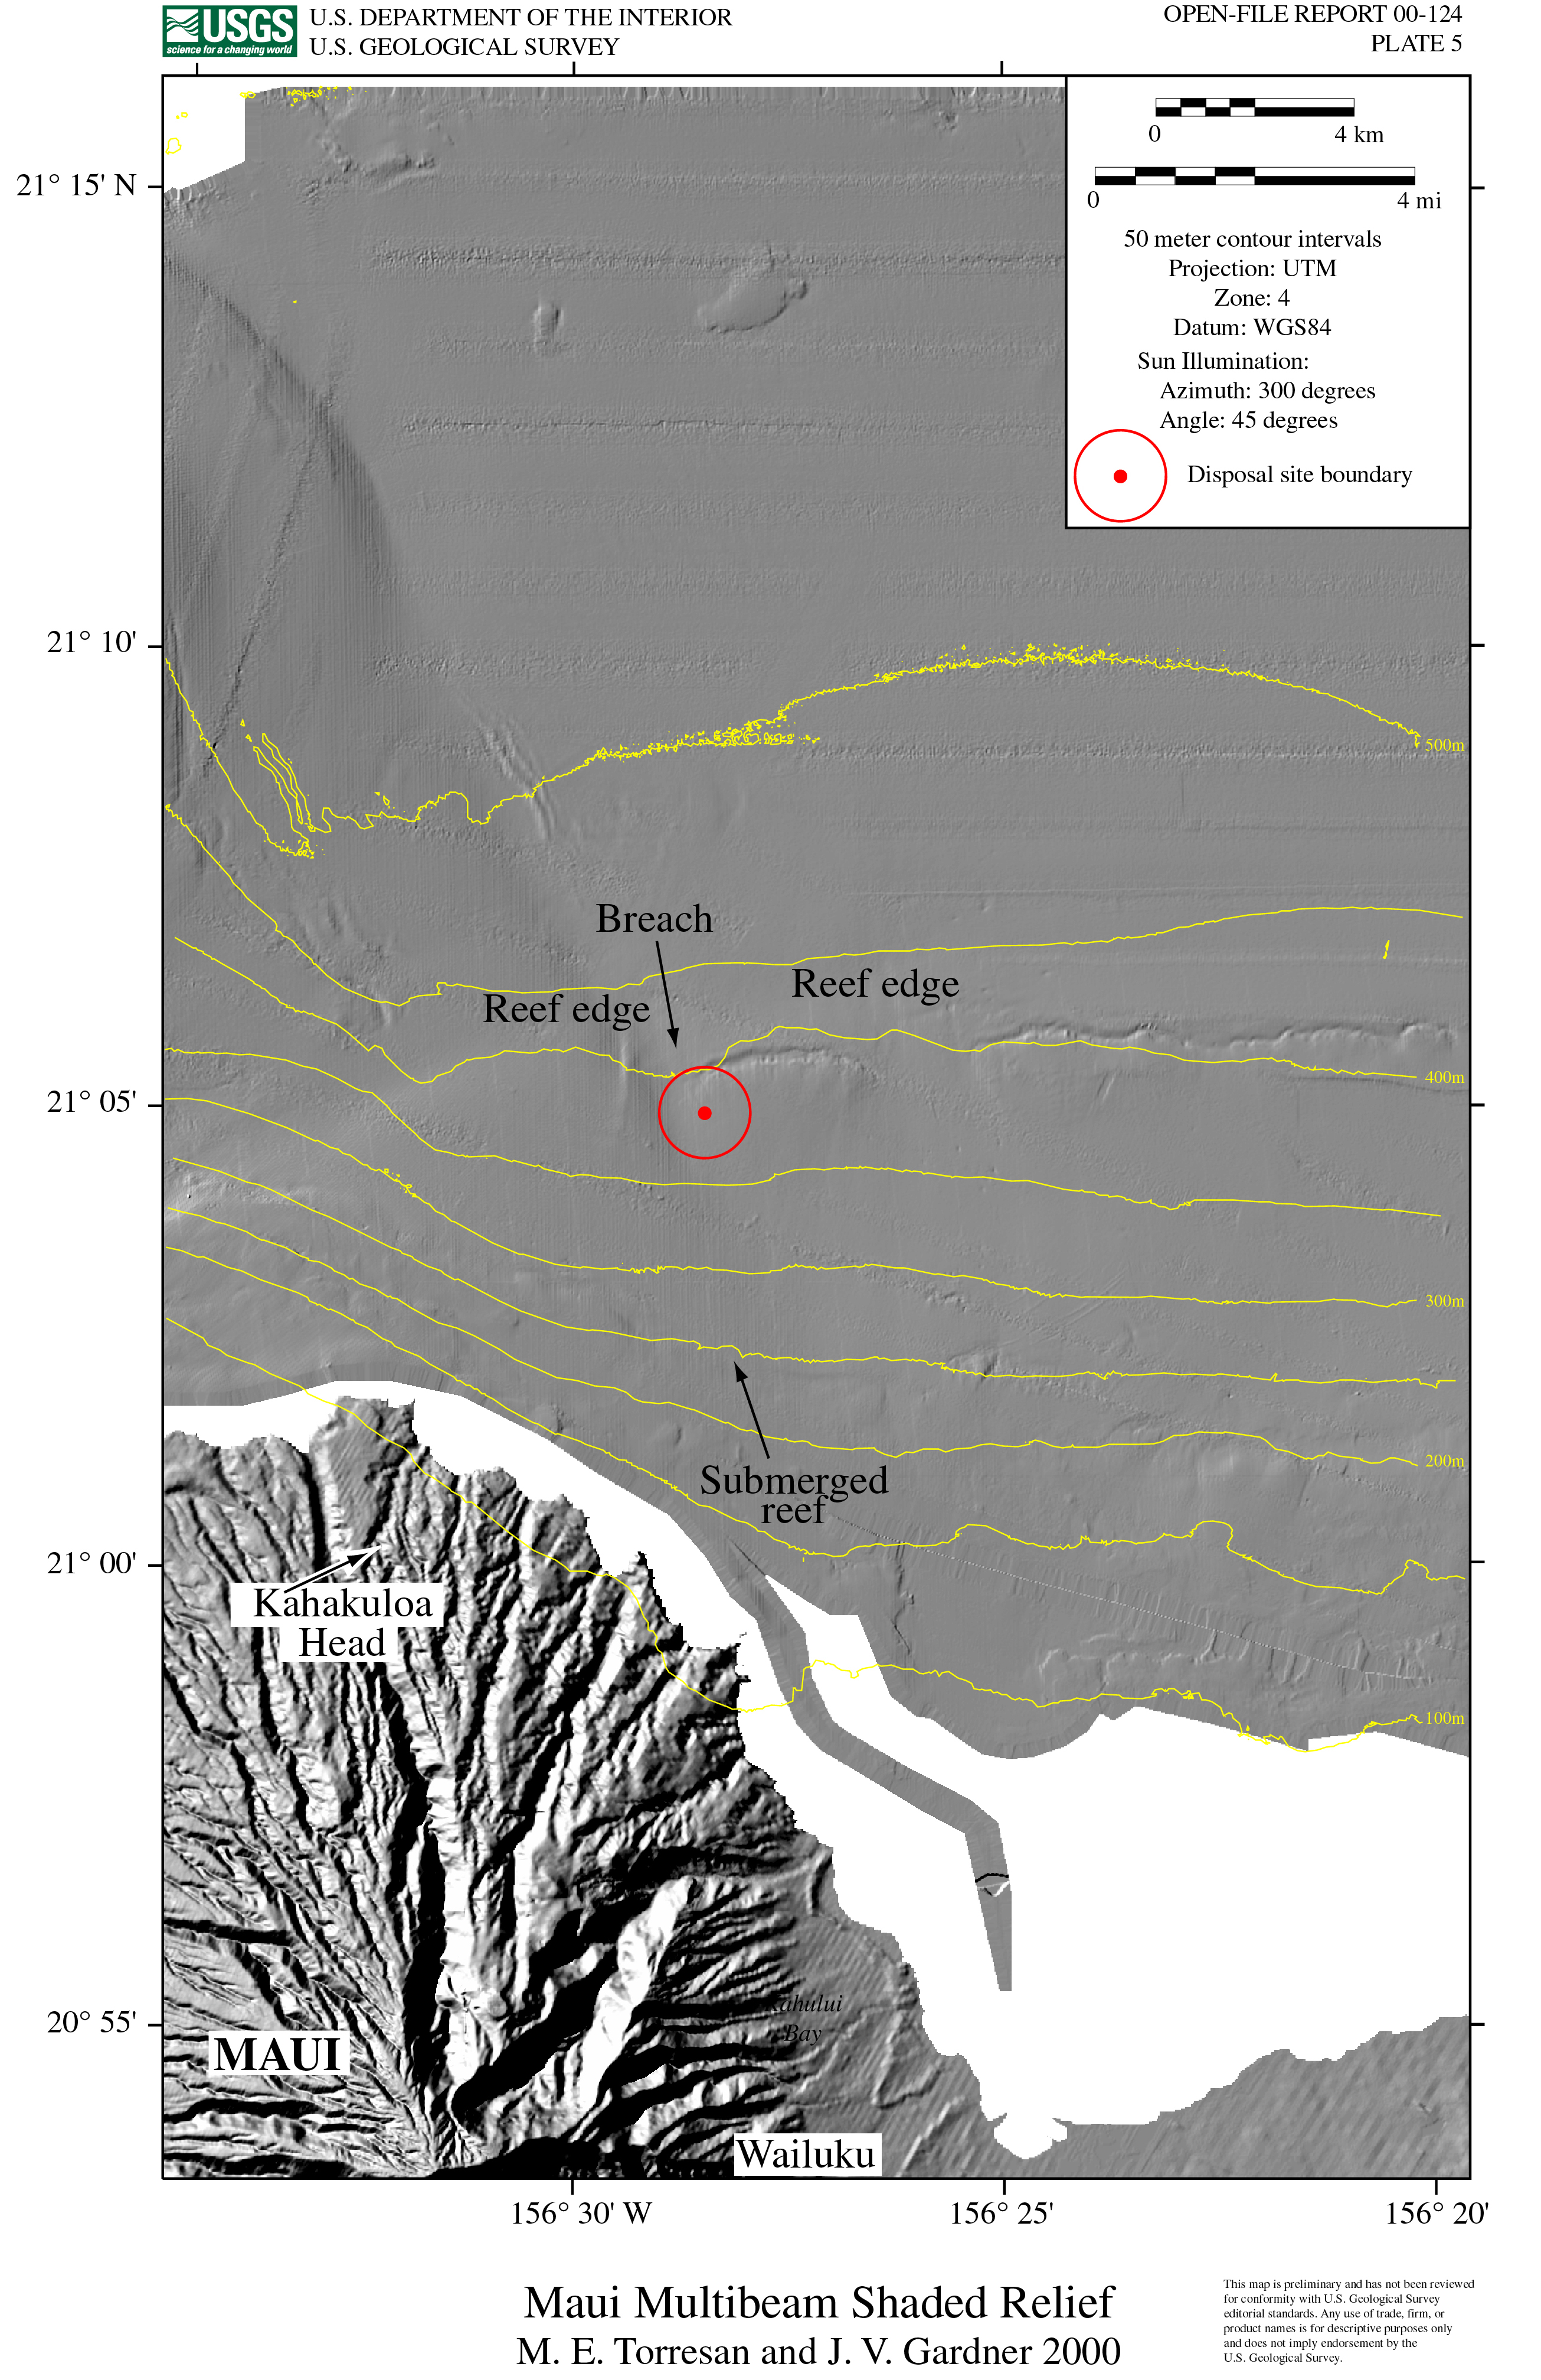
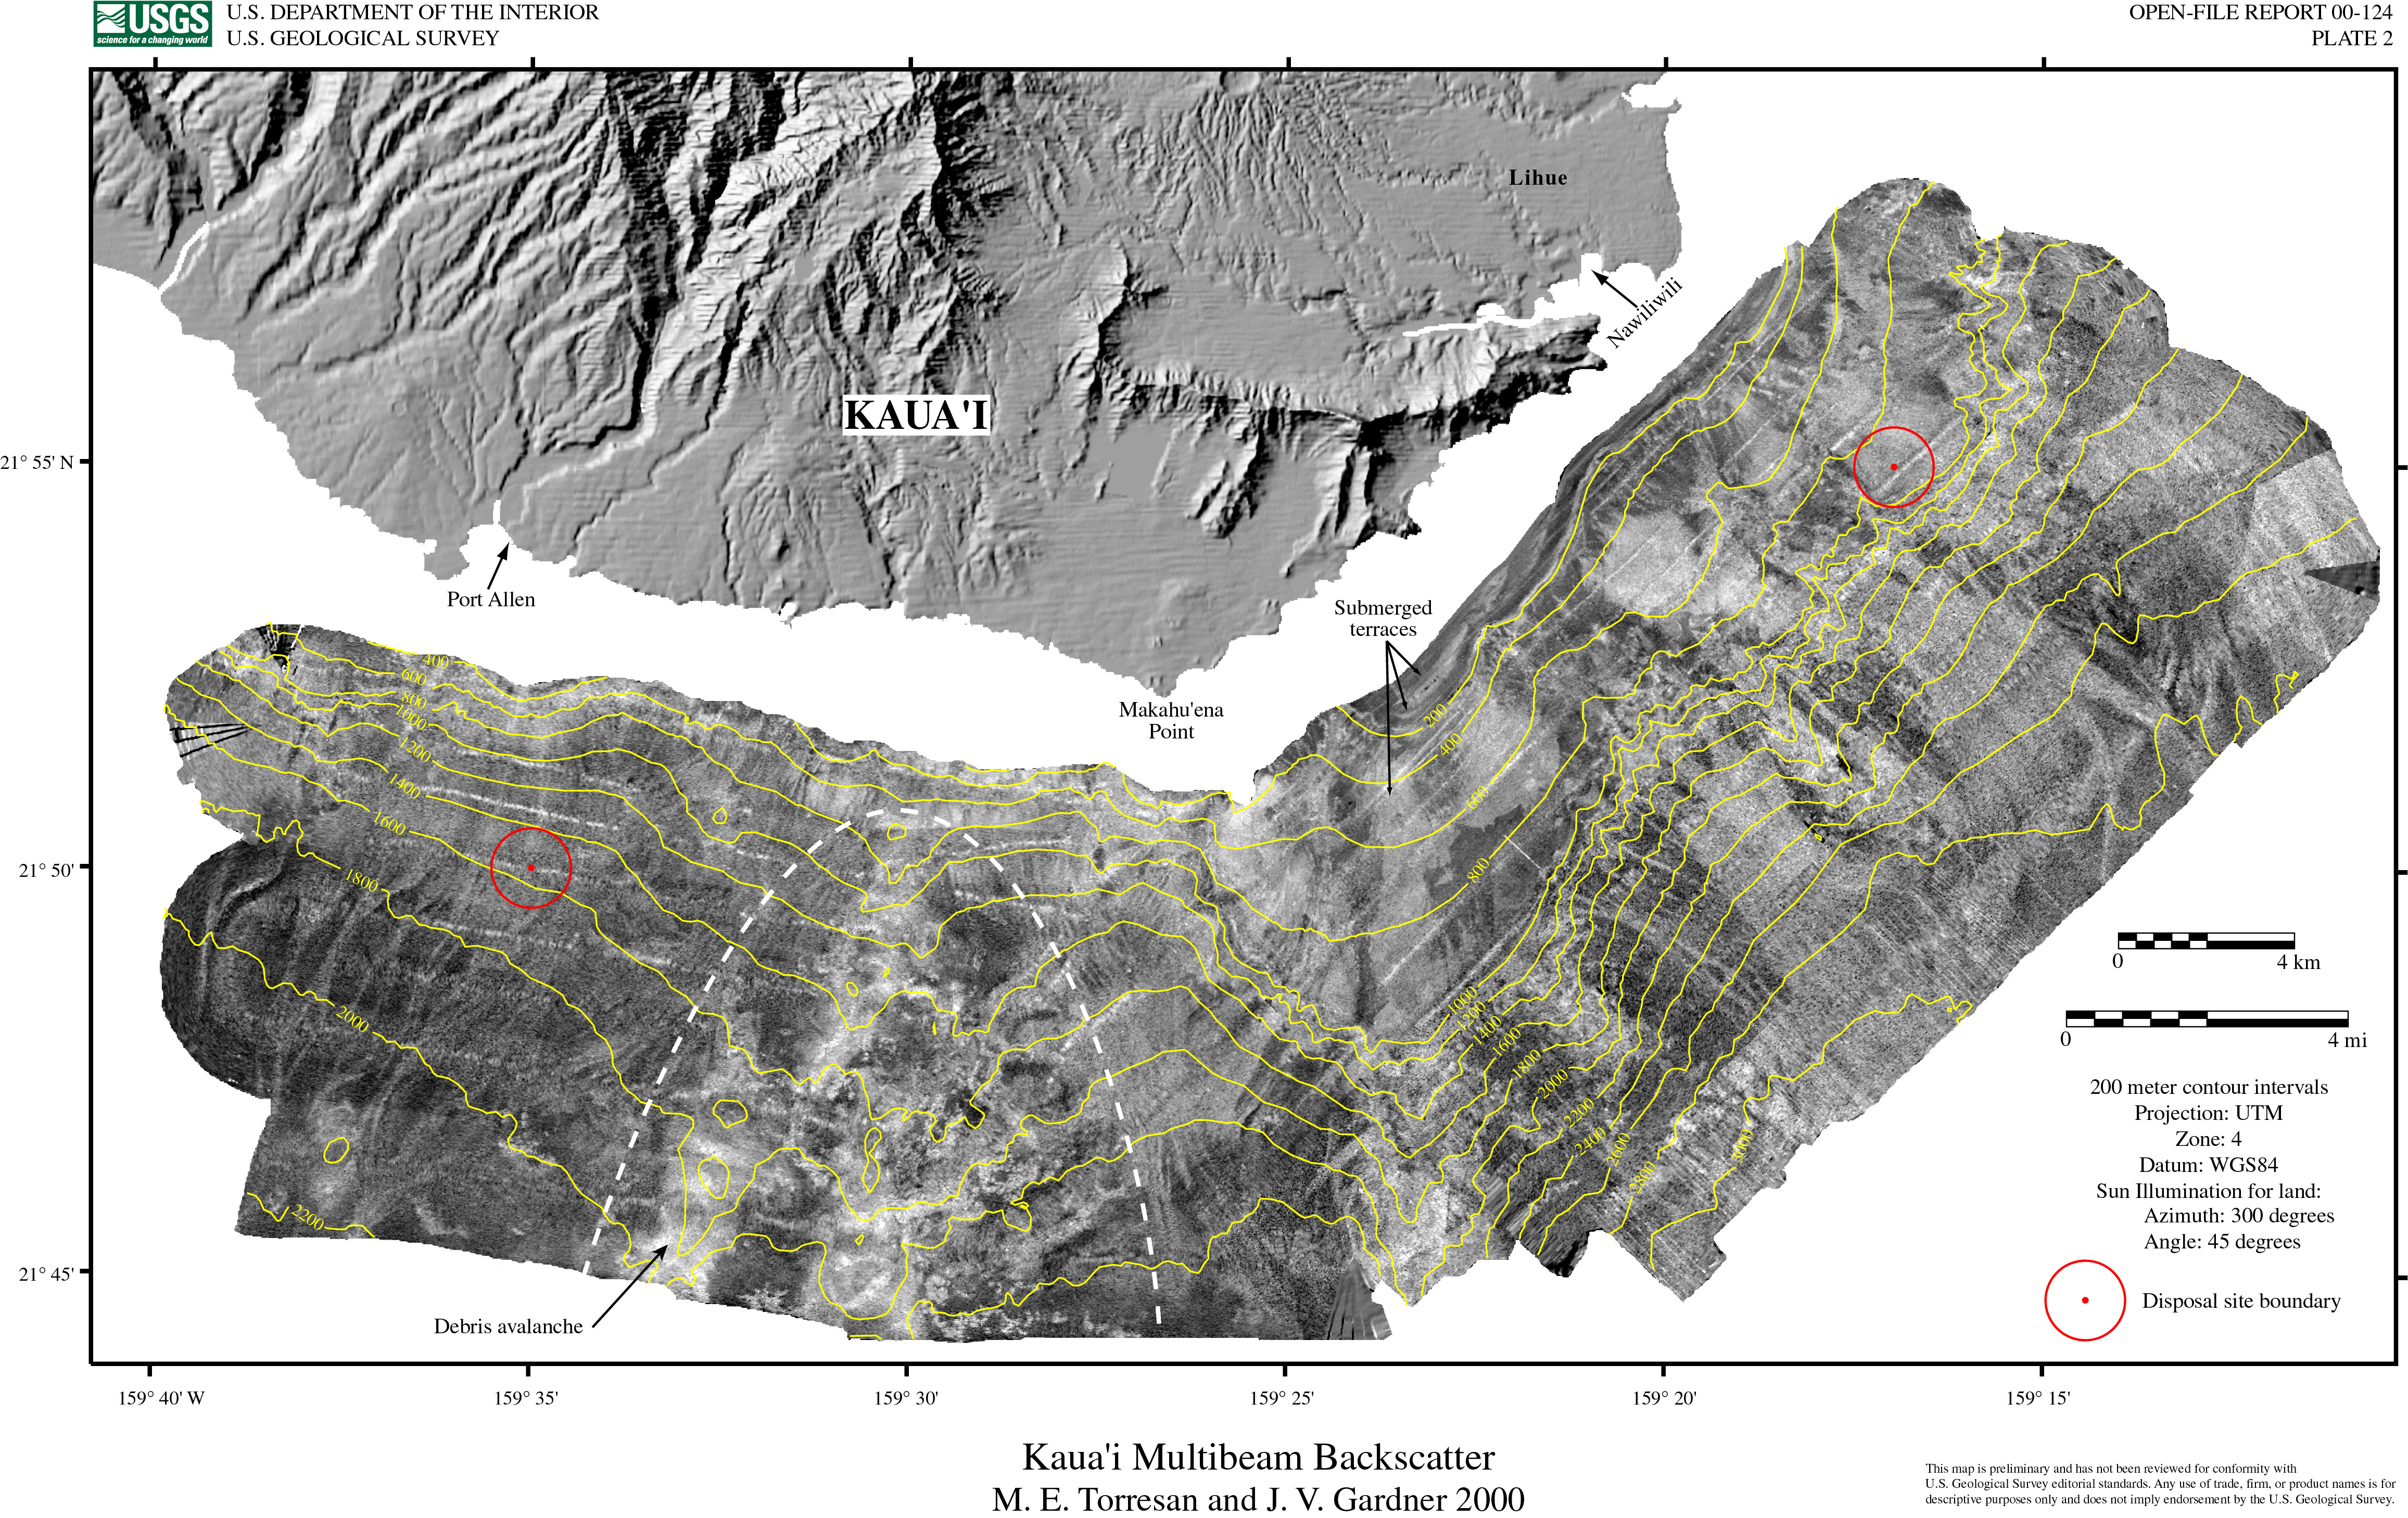
Regional Shaded-Relief and Backscatter MapsThis report is based on two types of digital maps; georeferenced, coregistered, gridded shaded-relief bathymetry and backscatter maps. The large, folded, overview maps of shaded-relief bathymetry and backscatter that accompany this report (Plates 1-8) were generated from high-resolution subarea maps. The subarea maps (4-m pixel resolution) were regridded at 8-m pixel resolution to produce the overview maps. The regridding reduces resolution in the shallower areas but allows the entire area to be mapped at a constant grid size. The detailed maps of the disposal sites were produced at the maximum resolution allowable by the data. Bathymetric charts of contours represent the more traditional method of displaying bathymetry. Contours were derived from gridded, tide-corrected depths. The resultant contours were smoothed by a 3-point running average and overlayed onto the maps. When contours are used by themselves (i.e., a traditional bathymetric map) more than 95% of the data must be discarded so as to only show some chosen contour interval. A much better representation of bathymetry, using 100% of the data is a shaded-relief map as shown in Plates 1, 3, 5, and 7.
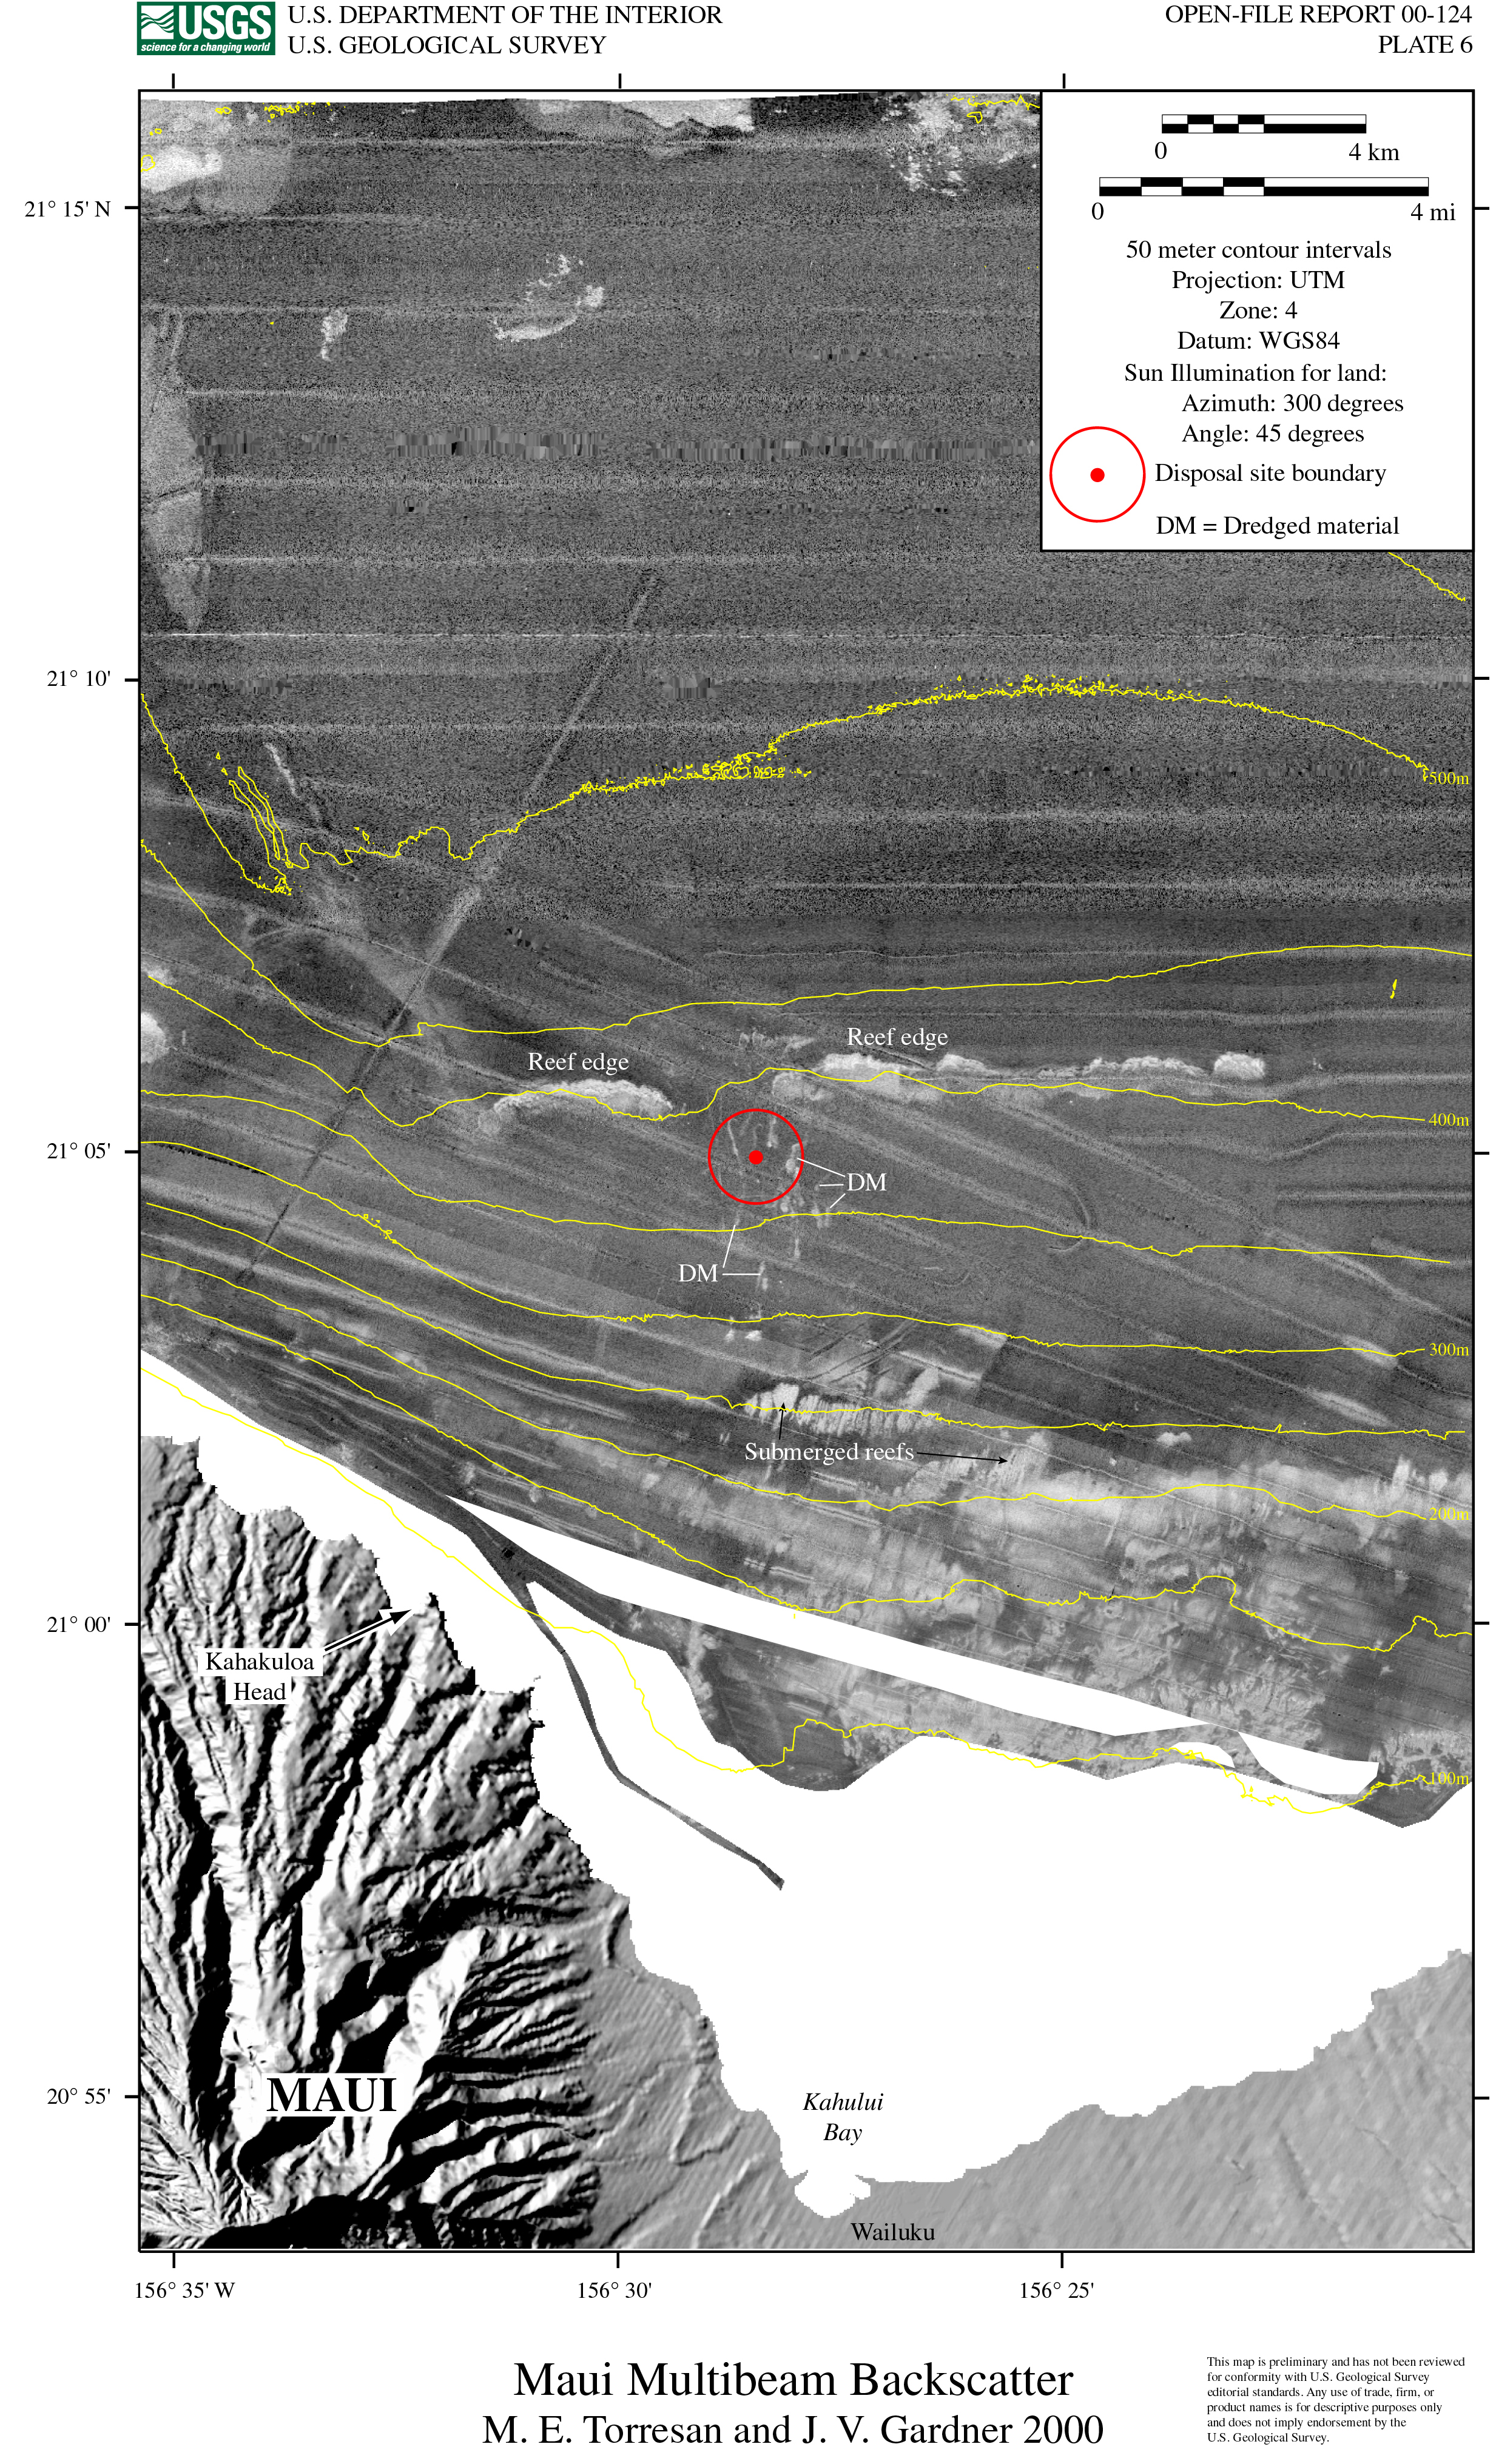
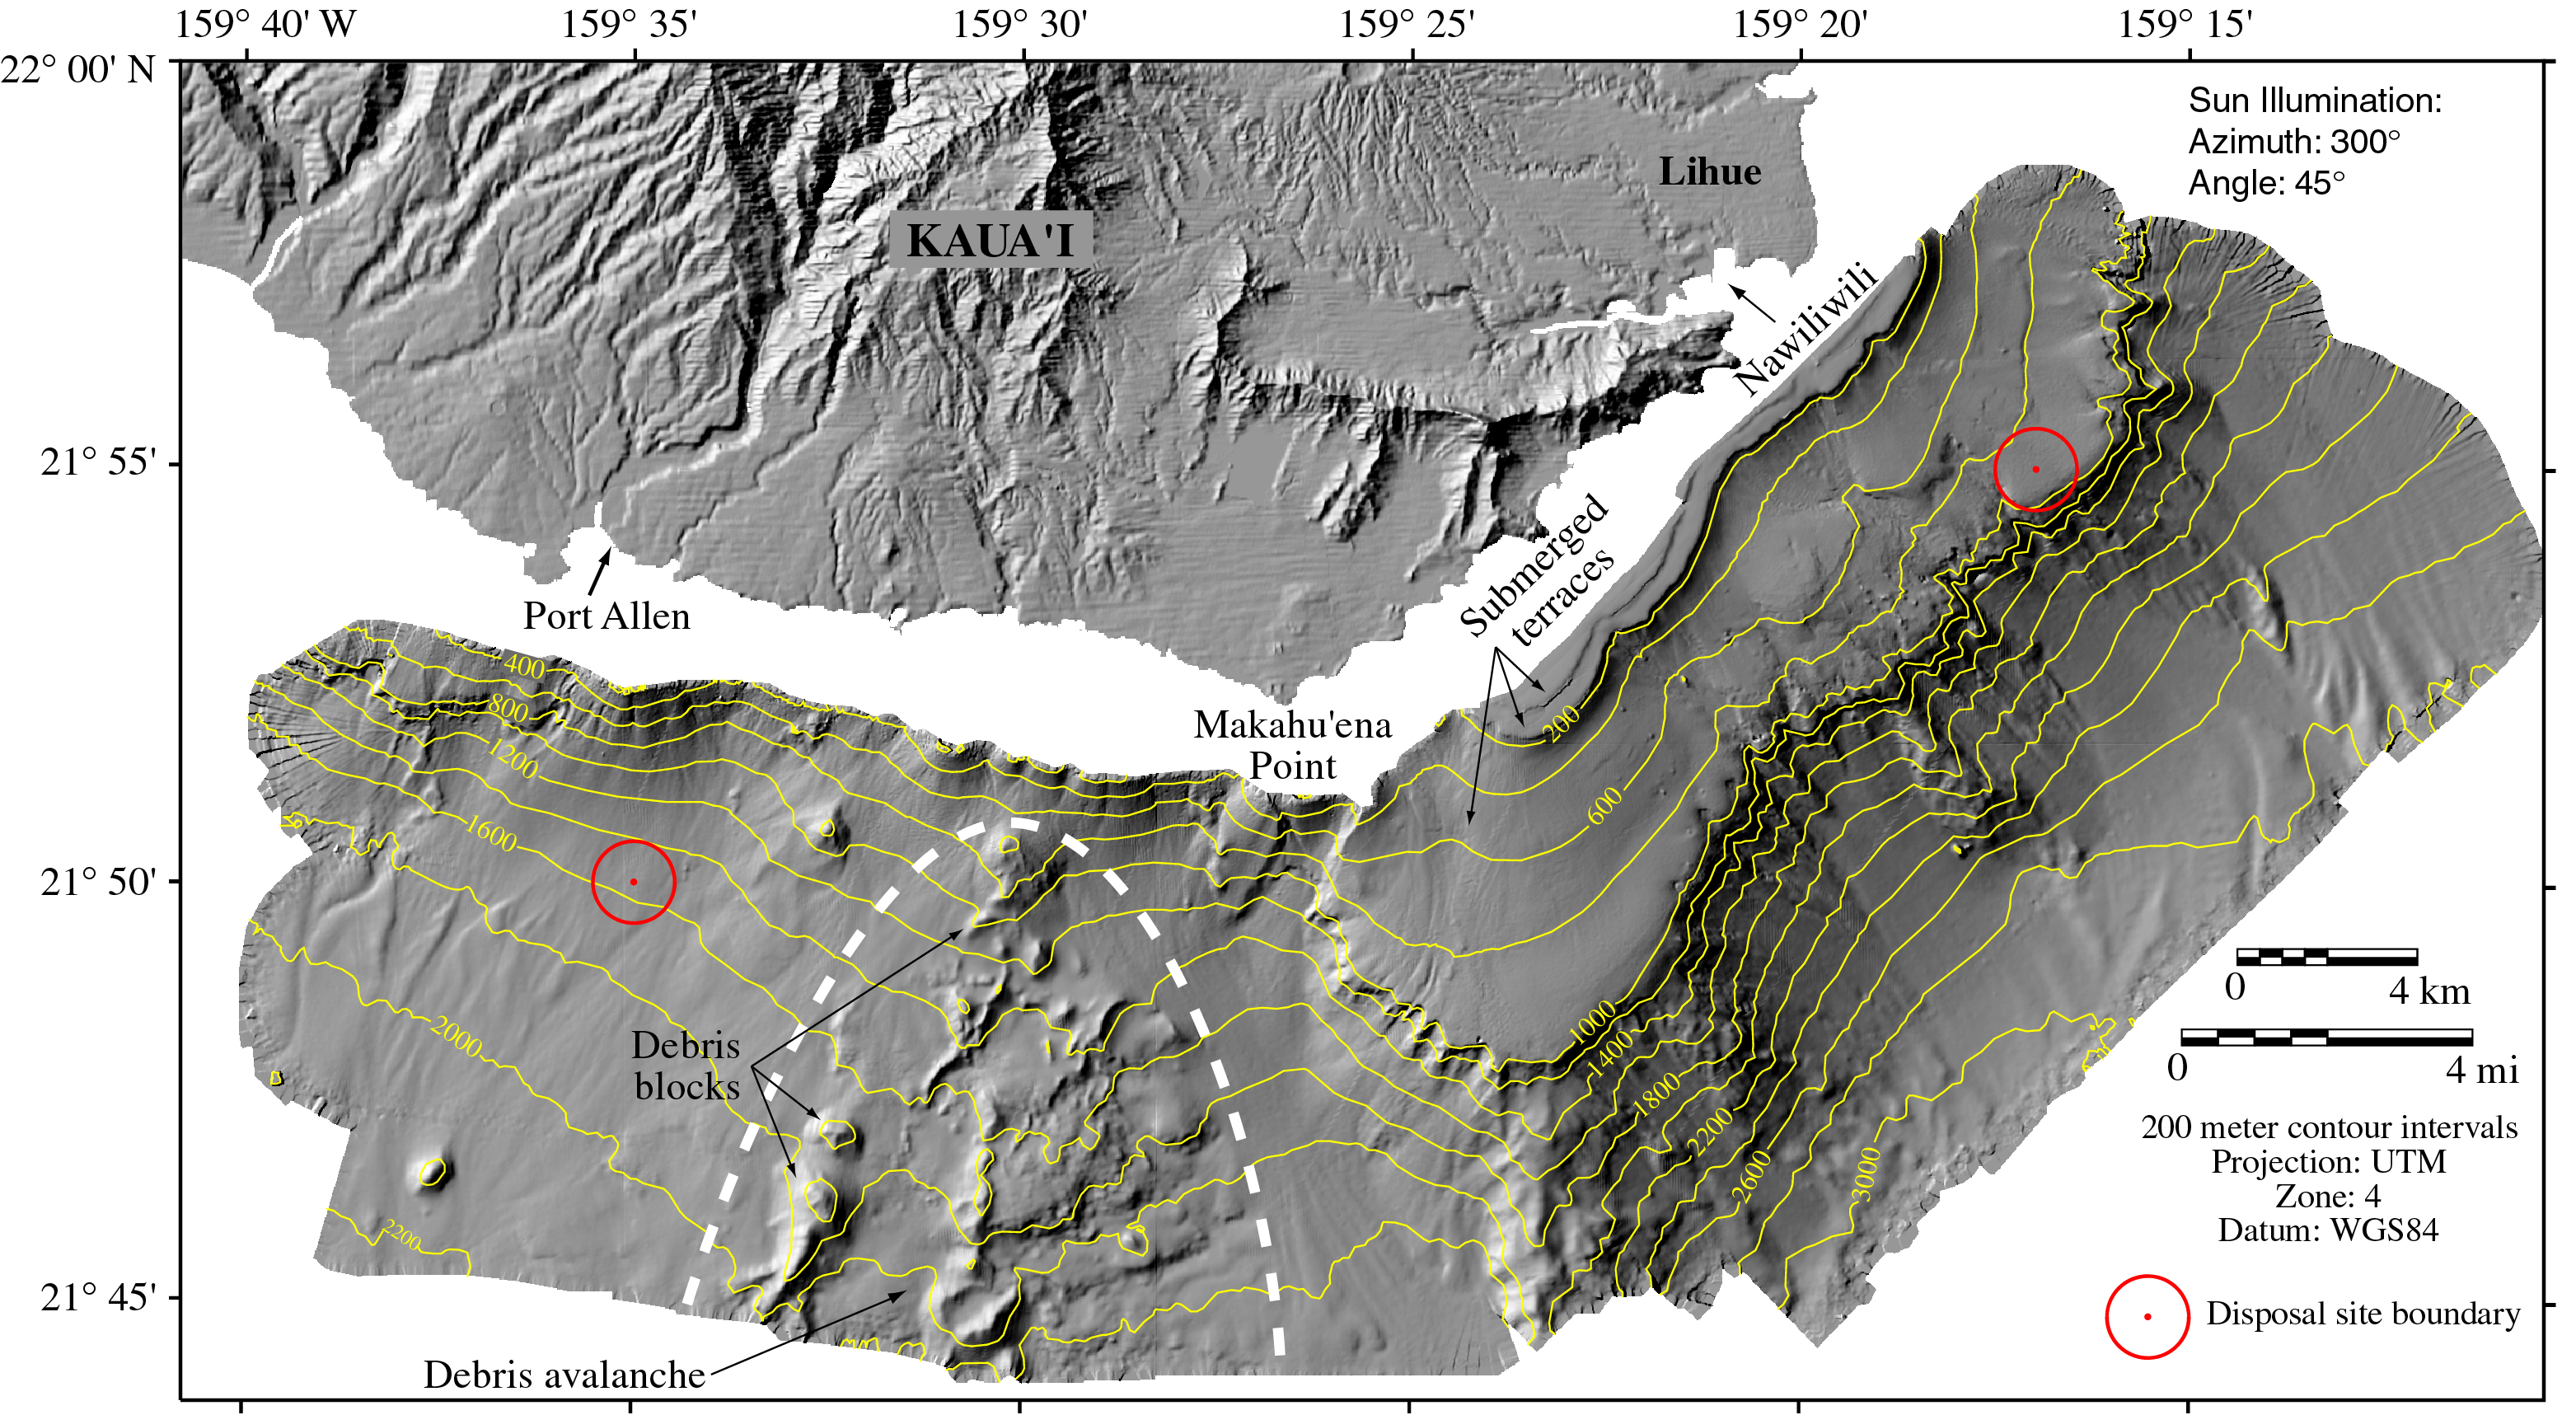
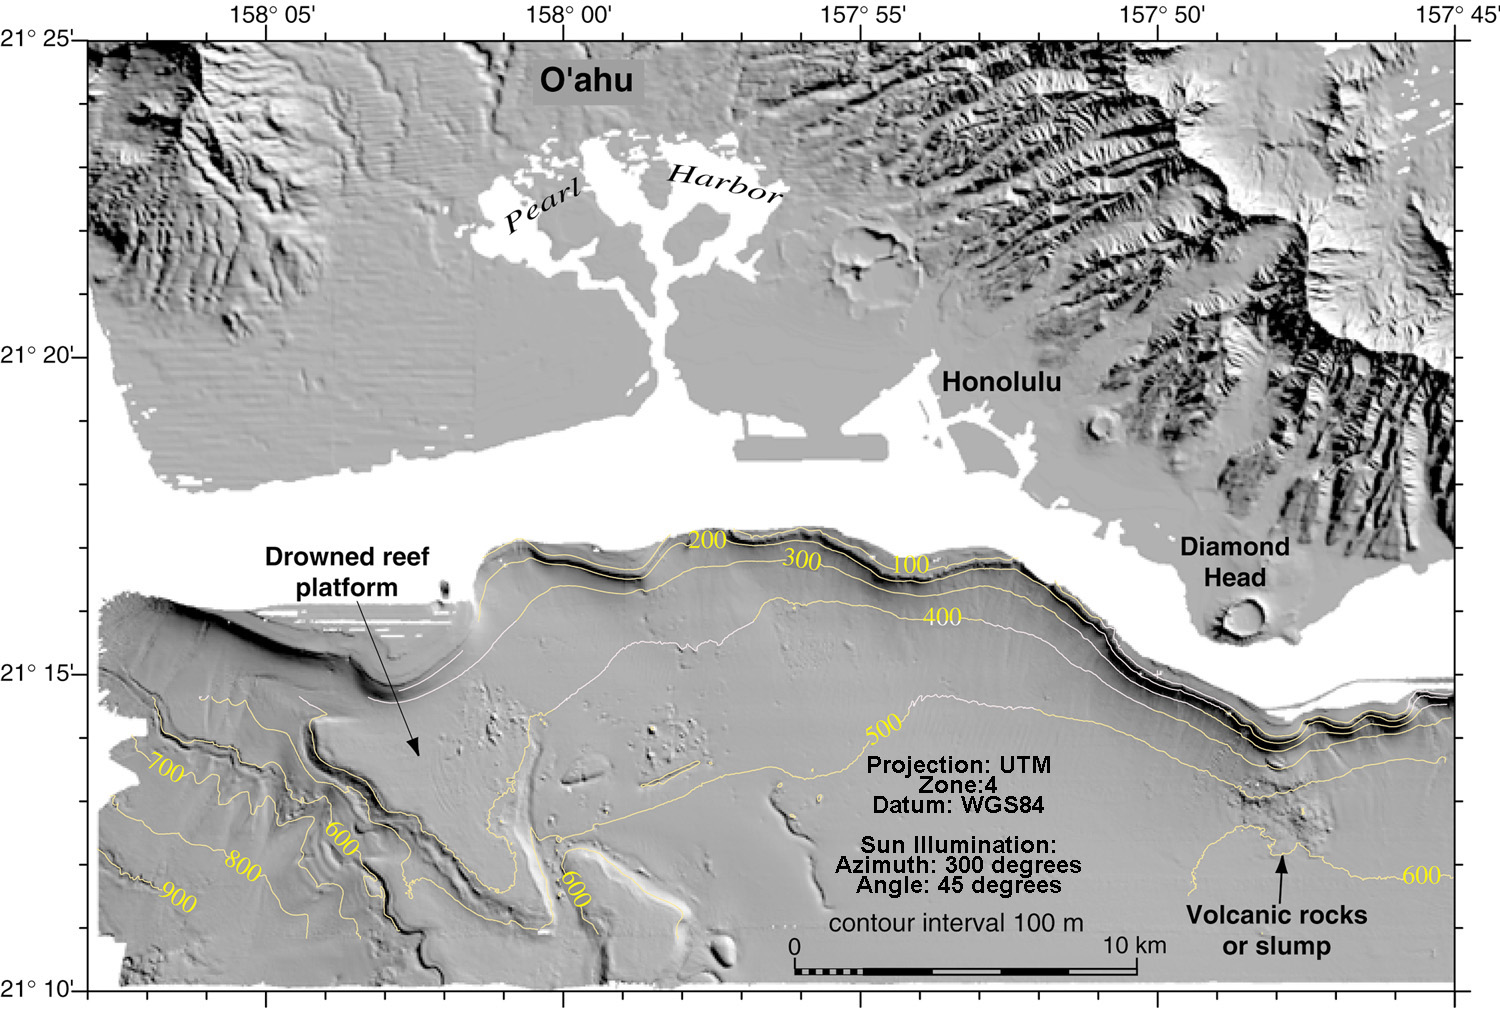
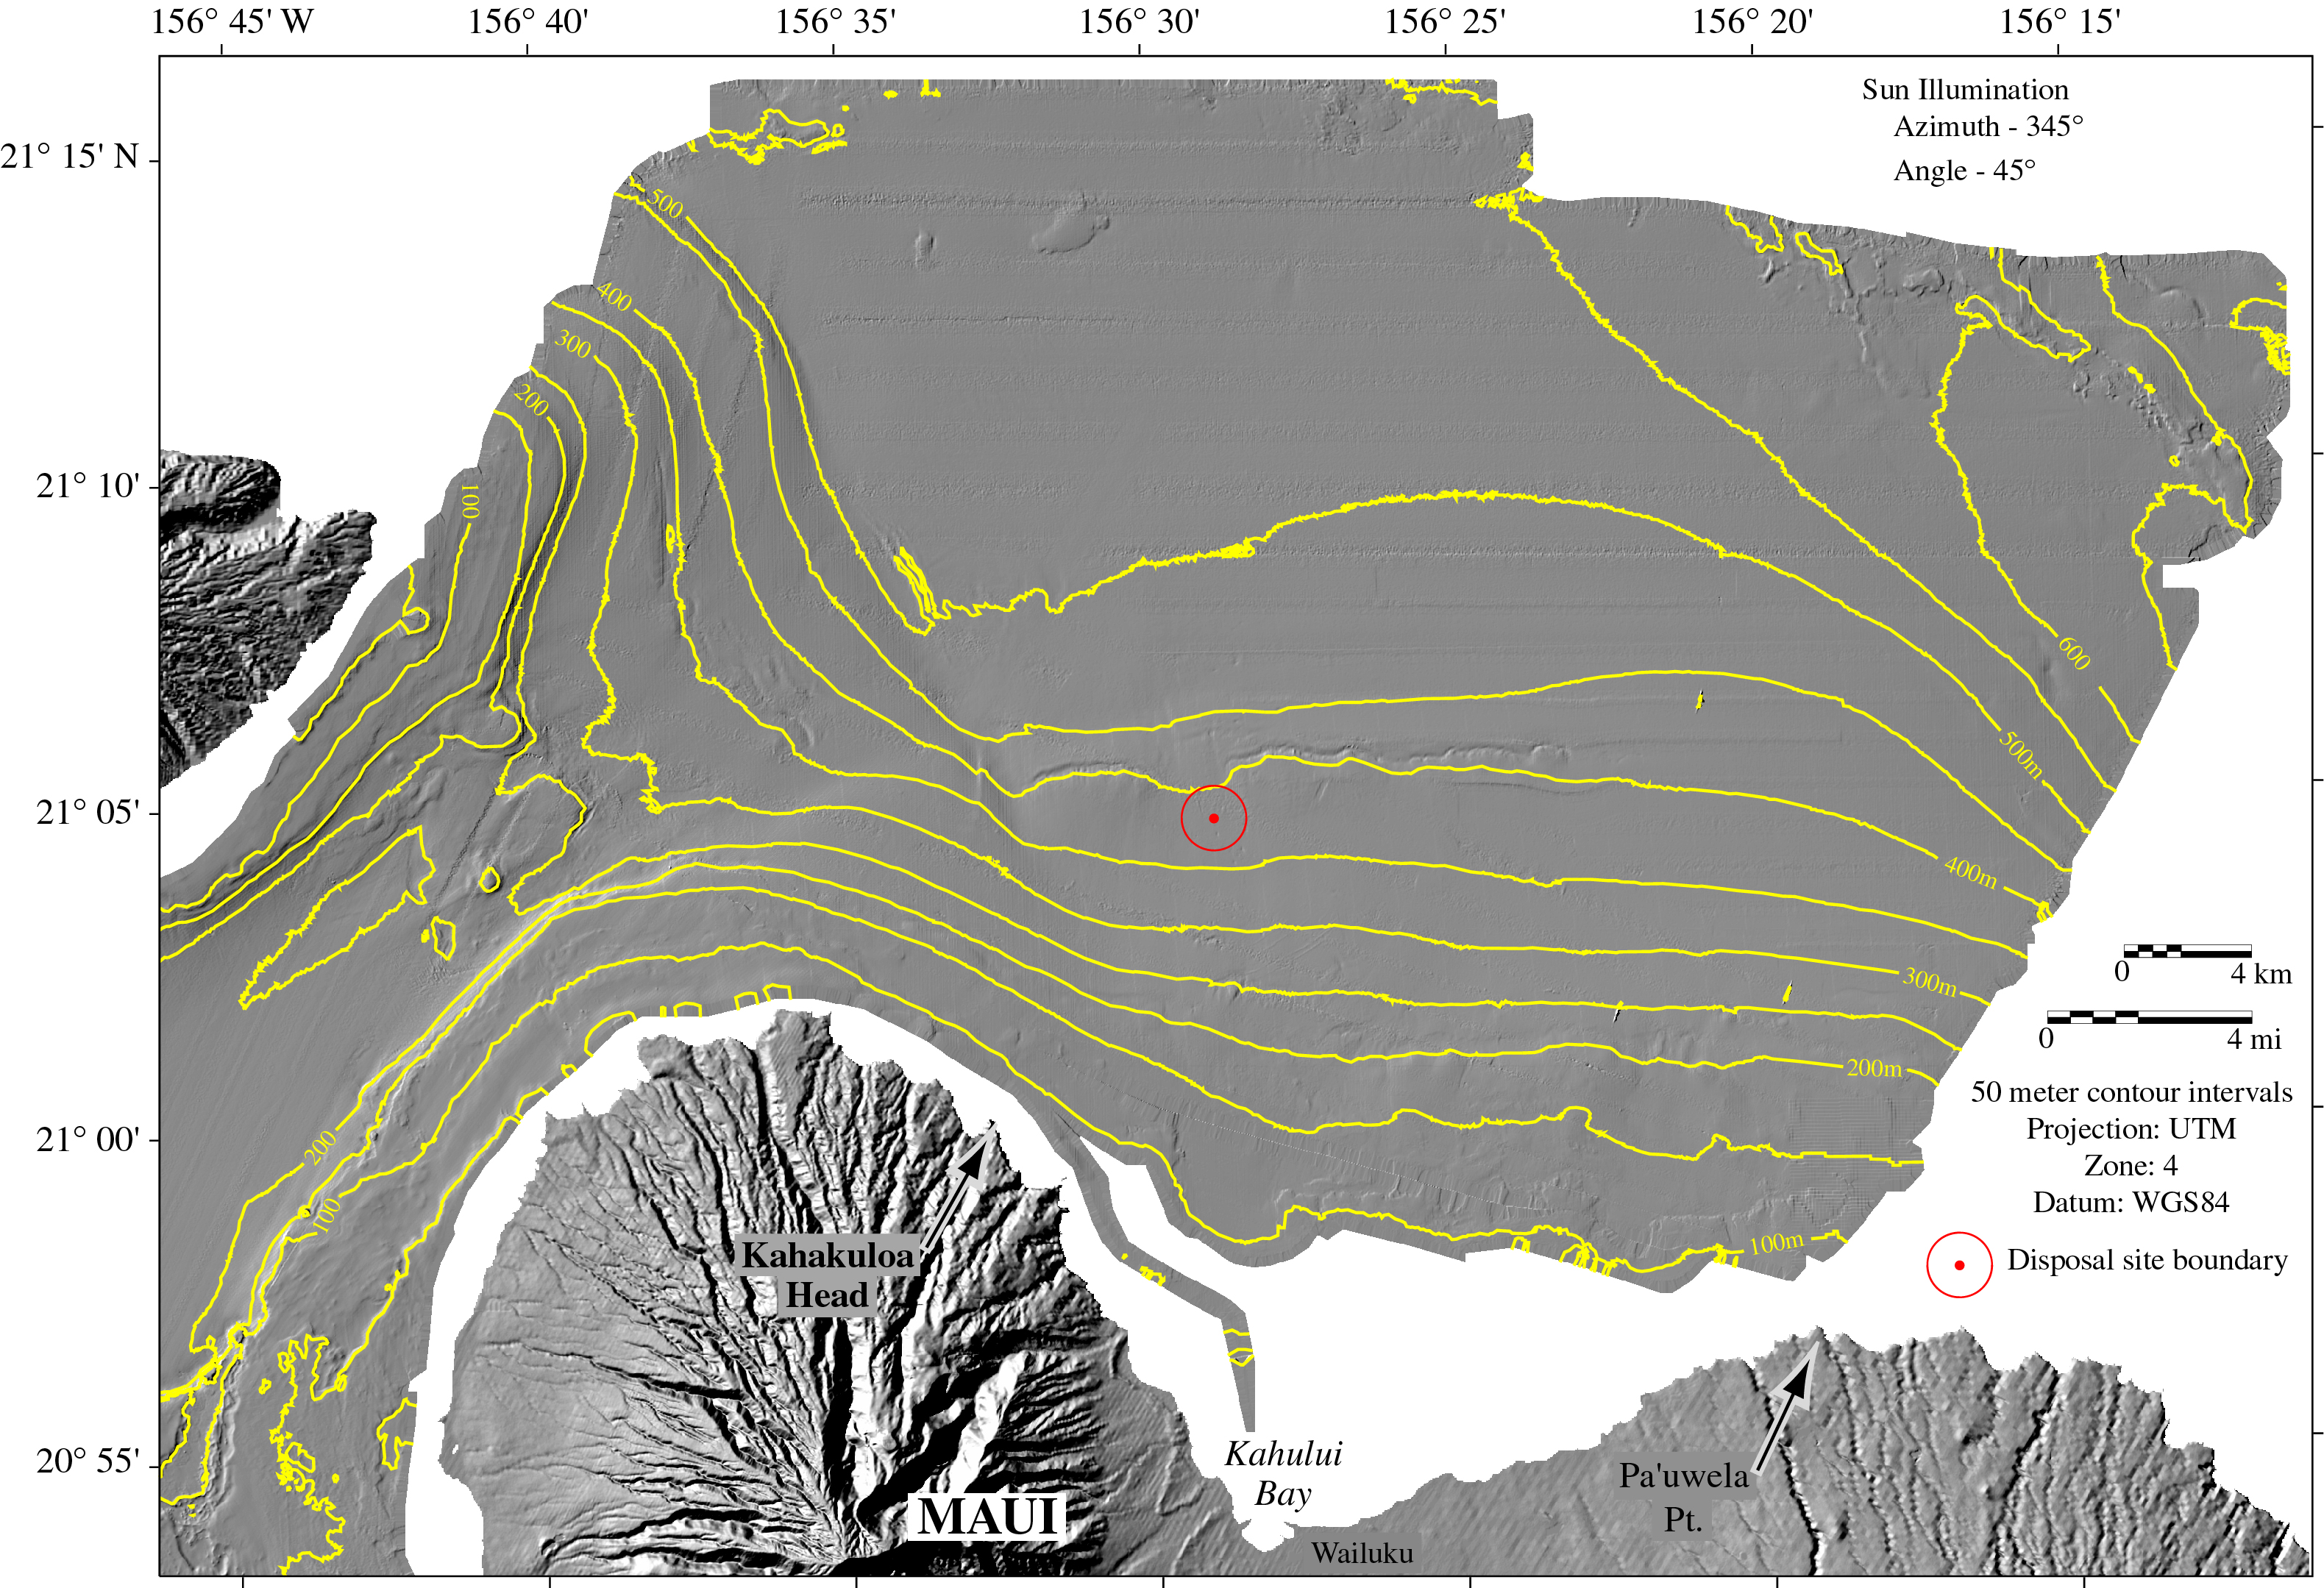
A shaded-relief map is a pseudo-sun-illumination of a topographic surface using the Lambertian scattering law (equation 1), where B is the illumination brightness, I is the maximum brightness, and F is the angle between illumination and a normal to the bathymetric surface. All shaded-relief maps and figures shown in this report (Plates 1, 3, 5, and 7; Figures 2, 11, 17, and 22) use an illumination azimuth and elevation of 300° and 45° respectively. A backscatter map (Plates 2, 4, 6, 8) is a representation of the amount of acoustic energy, at 30 kHz, that is scattered back from the seafloor to hull-mounted receivers.
Backscatter can be thought of as albedo; that is, the actual reflectance of the seafloor to 30-kHz sound. The Kongsberg Simrad EM300 system has been calibrated to a RMS pressure referenced to 1 mPa at 1 m from the transmitter. All gains, amplifications, etc., that are applied during signal generation and detection are separately recorded for each of the 135 beams and removed from the backscatter amplitude prior to recording. Consequently, the backscatter is calibrated to an absolute reflectance of the seabed in decibels (dB; equation 2) where I1 is the measured backscattered amplitude and I2 is the reference pressure of 1. The gridded bathymetry is completely georeferenced with the backscatter data, which means that each pixel on the map has a latitude, longitude, depth, and backscatter value assigned to it. This eliminates any ambiguity created by deforming one data set to fit another. The georeferenced and coregistered digital maps derived from the surveys can be employed for site evaluation and change detection between temporally separated surveys over the same sites, and for locating future sampling sites within and around site boundaries. For example, the gridded bathymetry and backscatter data can be input into a geographic information system (GIS) such as ArcInfo, and individual marine disposal mounds (MDM) and more extensive dredged material deposits can be digitally outlined. The relief of a deposit can be determined by producing a plane inclined at the calculated regional slope and placing the plane at the regional seafloor beneath each MDM. Thus, disposal site managers can then determine the relief from the difference in depth between the inclined plane and the gridded bathymetry, thereby allowing a calculation of volume to the precision of the bathymetry (30 cm). This technique was successfully applied at the LA-5 disposal site off of San Diego California (Gardner and Mayer, 1998). |
|||||||||||||
|
For more information, contact the PCMSC team.
Any use of trade, product, or firm names is for descriptive purposes only and does not imply endorsement by the U.S. Government. Suggested citation: Torresan, Michael E. and Gardner, James V., 2000, Acoustic Mapping of the Regional Seafloor Geology in and Around Hawaiian Ocean Dredged-Material Disposal Sites: U.S. Geological Survey Open-File Report 00-124, https://pubs.usgs.gov/of/2000/0124/. U.S. Department of the Interior U.S. Geological Survey |

![]() U.S. Department of the Interior |
U.S. Geological Survey
U.S. Department of the Interior |
U.S. Geological Survey
URL: http://pubsdata.usgs.gov/pubs/of/2000/0124/maps.html
Page Contact Information: GS Pubs Web Contact
Page Last Modified: Wednesday, 07-Dec-2016 18:15:45 EST


