USGS Circular 1316
Synthesis of U.S. Geological Survey Science for the Chesapeake Bay Ecosystem and Implications for Environmental Management | ||||||
Chapter 2: Human Population Growth and Land-Use Change | ||||||
|
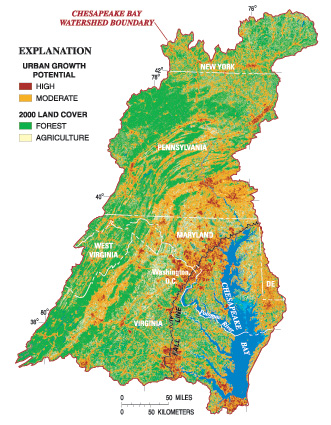
Human activities and their associated impact on the landscape have significantly affected the condition of the Chesapeake Bay and its watershed. The Bay watershed is one of the most populous coastal estuaries in the United States and over the past 20 years has experienced the largest increase in population compared to all other coastal watersheds in the United States (Crossett and others, 2004). The population of the Chesapeake Bay watershed grew from 8.1 million in 1950 to almost 16 million in 2000, greatly expanding urban and suburban areas. To help address the impacts of population growth, the Chesapeake 2000 agreement includes a goal to develop, promote, and achieve sound land-use practices which protect and restore watershed resources, maintain reduced pollutant loadings for the Bay and its tributaries, and restore and preserve aquatic living resources. Two specific restoration commitments for this goal include (1) by 2012, reduce the rate of urban sprawl by 30 percent, and (2) permanently preserve from development 20 percent of the land area in the watershed by 2010. To support these commitments, the USGS established a related goal during 200106 to improve watershed and land-use data and analysis. This chapter synthesizes the USGS findings about the rate of urban sprawl in the watershed and outcomes from a vulnerability assessment. The USGS cooperated with the CBP partners to quantify the rate of urban land change as an approach to quantify the rate of urban sprawl. The USGS had previously conducted analysis that documented the increase of urban land use in the Baltimore-Washington area over the past 200 years and provided future projections (Acevedo, 1999). The USGS worked with the CBP partners to evaluate different methods to characterize urban sprawl and determined that impervious surface change would provide the best surrogate to track the rate of urban development. Analysis of land-cover information produced by the University of Marylands Regional Earth Science Application Center (Goetz and others, 2004) revealed that during the 1990s, the expansion of suburban areas was a major contributing factor to a 41-percent increase in impervious surface in the Bay watershed compared to an 8-percent increase in population (U.S. Environmental Protection Agency, 2004). Some of the contributing factors to the dispersed pattern of growth were consumer preferences for houses on large lots and commercial preferences for less expensive office and retail space. Further USGS analysis of satellite imagery and road data indicates that impervious surfaces compose about 18 percent of all urban lands in the Bay watershed. The majority of impervious surfaces results from the construction of roads, buildings, and parking lots; driveways, sidewalks, and other sources typically make up less than 20 percent of the impervious surfaces in a watershed (Tilley and Slonecker, 2006). The environmental consequences of impervious surfaces include increased water runoff from the land leading to higher peak streamflows, increased streambank and bed erosion, and downstream flooding (Konrad, 2003). Impervious surfaces also cause more rapid delivery of nutrients, sediment, and contaminants from the land to streams by routing runoff directly into streams and bypassing the filtration and retention services provided by wetlands and riparian forest buffers. Biological and chemical impairment of streams can occur when the proportion of impervious surfaces in a watershed exceeds 5 to 6 percent (Couch and Hamilton, 2002). The dispersed development patterns in the Bay watershed have resulted in a loss of forests and agricultural lands, which typically provide a combination of water quality, wildlife, and aesthetic benefits. State and local governments are using the data on development patterns to focus land conservation and restoration activities to reduce runoff and to develop policies that reduce the impacts of impervious surfaces. State population projections indicate that population increases in suburban and exurban counties will continue to occur. Over the past 30 years, the population of the Bay watershed increased by over 1 million persons per decade, and if these trends continue through the year 2030, the area of developed land will increase by more than 60 percent (Boesch and Greer, 2003). As part the CBP Resource Lands Assessment (RLA), which was developed to help identify lands for preservation, the USGS conducted a vulnerability assessment (Claggett and Bisland, 2004). The vulnerability assessment evaluated the relative potential risk of future land conversion to urban areas by 2010 based on proximity to the urban growth areas of the 1990s (fig. 2.1). The findings from the assessment imply that land-use change will continue to impact valuable lands and habitats in the Bay watershed. The vulnerability assessment is useful for evaluating development patterns and has been used by State resource agencies, together with other information, to more strategically prioritize lands for protection. The USGS also began to develop approaches to link different land-use change models with the CBP watershed model to predict nutrient and sediment loads through the year 2030. The USGS will develop a Chesapeake Bay Land Change Model that will also be a prototype for a National Land Change Community Modeling system. The predictions of nutrient and sediment loads for the period 201030 will be used to formulate additional strategies needed to improve the Bay ecosystem.
ReferencesAcevedo, W., 1999, Analyzing land-use change in urban environments: U.S. Geological Survey Fact Sheet 18899, 4 p. Claggett, P.R., and Bisland, C., 2004, Assessing the vulnerability of forests and farmlands to development in the Chesapeake Bay Watershed, in Proceedings of the IASTED International Conference on Environmental Modeling and Simulation, November 2224, 2004, St. Thomas, U.S. Virgin Islands. Couch, C., and Hamilton, P., 2002, Effects of urbanization on stream ecosystems: U.S. Geological Survey Fact Sheet 04202, 2 p. Crossett, K.M., Culliton, T.J., Wiley, P., and Goodspeed, T.R., 2004, Population trends along the Coastal United States, 19802008: Silver Spring, Maryland, National Oceanic and Atmospheric Administration, National Ocean Service, 47 p. Goetz, S.J., Jantz, C.A., Prince, S.D., Smith, A.J., Varlyguin, D., and Wright, R.K., 2004, Integrated analysis of ecosystem interactions with land use change: the Chesapeake Bay watershed, pages 263275 in DeFries, R.S., Asner, G.P., and Houghton, R.A., eds., Ecosystems and land use change: Washington, D.C., American Geophysical Union, Geophysical Monograph Series. Konrad, C.P., 2003, Effects of urban development on floods: U.S. Geological Survey Fact Sheet 07603, 4 p. Tilley, J., and Slonecker, T., 2006, Quantifying the components of impervious surfaces: U.S. Geological Survey Open-File Report 20071008, 40 p. U.S. Environmental Protection Agency Chesapeake Bay Program, 2004, Resource lands assessment, October 2005: Annapolis, Maryland, [variously paged]. | |||||

![]() U.S. Department of the Interior |
U.S. Geological Survey
U.S. Department of the Interior |
U.S. Geological Survey
URL: http://pubsdata.usgs.gov/pubs/circ/circ1316/html/circ1316chap2.html
Page Contact Information: GS Pubs Web Contact
Page Last Modified: Tuesday, 10-Jul-2018 11:00:21 EDT