USGS Circular 1316
Synthesis of U.S. Geological Survey Science for the Chesapeake Bay Ecosystem and Implications for Environmental Management | |||||||
Chapter 3: Factors Affecting the Distribution and
Transport of Nutrients | |||||||
|
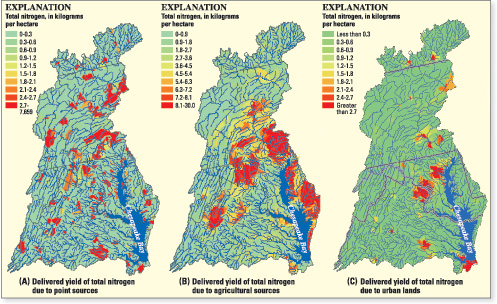
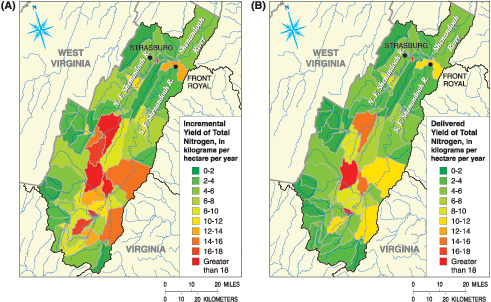
In the Chesapeake 2000 agreement, the goal for water quality is to achieve and maintain the water quality necessary to support aquatic living resources of the Bay and its tributaries and to protect human health. Related to this goal is a commitment to correct nutrient- and sediment-related problems in the Bay and its tributaries in order to remove the Bay from the impaired waters list by 2010. This chapter summarizes USGS efforts to better understand the distribution and transport of nutrients using a watershed modeling application, known as SPAtially Referenced Regressions On Watershed attributes (SPARROW). SPARROW models use a nonlinear regression approach to define relations among nutrient sources, stream nutrient loads, and the environmental factors that potentially affect nutrient transport (Smith and others, 1997; Schwarz and others, 2006). Results from the SPARROW models provide (1) a statistical basis for estimating stream nutrient loads in unmonitored locations, and (2) the statistical significance of nutrient sources, environmental factors, and transport processes in explaining predicted nutrient loads. The distribution and transport of nutrient sources in the Chesapeake Bay watershed have been evaluated by the USGS using the SPARROW methodology. Models of total nitrogen and total phosphorus were developed for the Chesapeake Bay watershed, estimating water-quality conditions for three snapshots in time: the late 1980s-Version 1.0 (Preston and Brakebill, 1999; Brakebill and Preston, 1999), the early 1990s-Version 2.0 (Brakebill and others, 2001), and the late 1990s-Version 3.0 (Brakebill and Preston, 2004). Spatial data representing nutrient source quantities for each specified time period were compiled and include: atmospheric deposition, point-source locations, septic systems (Version 2.0 only), land use, land cover, and agricultural sources including commercial fertilizer and manure applications. Environmental characteristics datasets representing factors that affect the transport of nutrients (land-to-water delivery) also were compiled. The fate and transport of nitrogen within a drainage catchment are influenced by watershed characteristics (such as slope, lithology, and geologic structure) and processes within the stream channel. Soil permeability (Version 1.0) and area within the Coastal Plain Physiographic Province (Versions 2.0 and 3.0) were identified in the SPARROW models as statistically significant watershed characteristics that affect the transport of nitrogen to streams. These factors may reflect the potential for nitrogen to flow through ground-water pathways that are slower and provide more potential for loss through denitrification (Brakebill and Preston, 2004). Additionally, the effect of in-stream loss processes, represented as a function of stream traveltime based on various streamflow classes and the presence of reservoirs, is a significant factor affecting the transport of nitrogen in streams (Brakebill and Preston, 2004; Preston and Brakebill, 1999). Smaller streams (those less than 200 cfs, or cubic feet per second), tend to have higher nitrogen loss than larger streamsthose greater than 1,000 cfs. Smaller, shallower streams have more contact with bottom sediments and have a greater potential for total nitrogen loss due to biological processing and denitrification. Resource managers have identified three nutrient sources—point sources, agriculture, and urban lands— as high priorities for nutrient-reduction actions. The spatial distribution of the amount of nitrogen delivered (expressed as yield) from each major source as it is transported to the Chesapeake Bay estuary is shown in figure 3.1. This information is being used to identify geographic areas where management actions designed to reduce nitrogen to the estuary should be implemented. The USGS also has provided the SPARROW model results for each of the tributary strategy basins, which are the geographic areas with specific nutrient and reduction goals, so resource managers can identify local areas with the highest delivery of nutrients to local streams and the estuary. An example of the SPARROW model results for the Shenandoah Valley tributary strategy basin is shown in figure 3.2. The amount of nitrogen that is generated locally and transported to streams (incremental yield) is shown in figure 3.2A, and the amount of nitrogen that is generated locally and would be transported to the estuary (delivered yield) is shown in figure 3.2B. The maps can be used together to better define areas where management actions may improve water quality both in local streams and the estuary. Information from the SPARROW models was also used to refine the segmentation for the CBP Phase V watershed model (Martucci and others, 2005), and to help design the CBP nontidal water-quality network (Brakebill and Preston, 2003). Results from the network for nutrient and sediment trends are provided in Chapter 5.
ReferencesBrakebill, J.W., and Preston, S.D., 1999, Digital data used to relate nutrient inputs to water quality in the Chesapeake Bay watershed, Version 1.0: U.S. Geological Survey Open-File Report 9960, [variously paged]. Brakebill, J.W., and Preston, S.D., 2003, A digital hydrologic network supporting spatially referenced regression modeling in the Chesapeake Bay watershed, in Proceedings of the U.S. Environmental Protection Agency EMAP Symposium 2001: Coastal Monitoring Through Partnerships, Environmental Monitoring and Assessment, April 2427, 2001, Pensacola, Florida, [81:13] 7384, 403 p. Brakebill, J.W., and Preston, S.D., 2004, Digital data used to relate nutrient inputs to water quality in the Chesapeake Bay watershed, Version 3.0: U.S. Geological Survey Open-File Report 20041433, [variously paged]. Brakebill, J.W., Preston, S.D., and Martucci, S.K., 2001, Digital data used to relate nutrient inputs to water quality in the Chesapeake Bay, Version 2.0: U.S. Geological Survey Open-File Report 01251, [variously paged]. Martucci, S.K., Krstolic, J.L., Raffensperger, J.P., and Hopkins, K.J., 2005, Development of land segmentation, stream-reach network, and watersheds in support of Hydrological Simulation ProgramFortran (HSPF) modeling, Chesapeake Bay watershed, and adjacent parts of Maryland, Delaware, and Virginia: U.S. Geological Survey Scientific Investigations Report 20055073, 15 p. Preston, S.D., and Brakebill, J.W., 1999, Applications of spatially referenced regression modeling for the evaluation of total nitrogen loading in the Chesapeake Bay watershed: U.S. Geological Survey Water-Resources Investigations Report 994054, 12 p. Smith, R.A., Schwarz, G.E., and Alexander, R.B., 1997, Regional interpretation of water-quality monitoring data: Water Resources Research, v. 33, no. 12, p. 2,7812,798. Schwarz, G.E., Hoos, A.B., Alexander, R.B., and Smith, R.A., 2006, The SPARROW water-quality model: Theory, applications, and user documentation: U.S. Geological Survey Techniques and Methods 6B3, 248 p., CD-ROM. | ||||||

![]() U.S. Department of the Interior |
U.S. Geological Survey
U.S. Department of the Interior |
U.S. Geological Survey
URL: http://pubsdata.usgs.gov/pubs/circ/circ1316/html/circ1316chap3.html
Page Contact Information: GS Pubs Web Contact
Page Last Modified: Tuesday, 10-Jul-2018 11:00:51 EDT