USGS Circular 1316
Synthesis of U.S. Geological Survey Science for the Chesapeake Bay Ecosystem and Implications for Environmental Management | |||||||
Chapter 5: Assessing Changes in Streamflow and Nutrients | |||||||
|
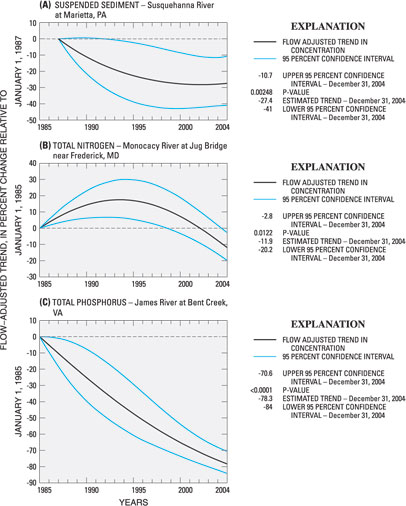
Monitoring and assessing streamflow and nutrient concentrations in the watershed provide critical information toward evaluating the progress of management actions to reduce nutrient and sediment loads in the watershed and their delivery to the estuary. This chapter summarizes USGS findings related to change in streamflow and nutrients in the watershed and the factors affecting water-quality change. Streamflow and water-quality monitoring in the watershed is conducted using three primary networksthe USGS stream-gaging network, the River-Input Monitoring (RIM) Program, and the CBP nontidal water-quality network. The stream-gaging network has multiple partners and purposescomputation of total river flow to the Bay and support of water-quality monitoring are the two primary applications for Chesapeake Bay studies. The USGS, in partnership with the Maryland Department of Natural Resources and the Virginia Department of Environmental Quality, began comprehensive water-quality monitoring in the 1980s through the RIM Program to estimate nutrient loads from the watershed to the estuary and assess concentration change over time. The RIM sites are at the head-of-tide on the nine major tributaries entering the Chesapeake Bay and collectively monitor approximately 80 percent of the Bay watershed (fig. 5.1). In 2004, the USGS partnered with USEPA and the six states in the watershed to establish the CBP Nontidal Water-Quality Network (fig. 5.1). The primary goal of the network is to identify the status and trends in water-quality conditions to help assess progress of the CBP tributary strategies to reduce nutrients and sediment to meet water-quality criteria in the estuary (U.S. Environmental Protection Agency, 2003). The partners in the network are using compatible sampling and analysis protocols to collect nutrient and sediment samples over a range of flow conditions at existing USGS stream-gaging sites. As of 2006, about one-third of the 200 proposed sites for the network had been fully implemented. The USGS has developed (Cohn and others, 1989; Hirsch and others, 1991; Helsel and Hirsch, 1992) and enhanced techniques (Langland and others, 2000, 2004, 2006) to better document changes in streamflow and nutrient concentrations over time. The water-quality changes are affected by the natural variability in streamflow and the changes in nutrient sources over time. The natural variability in streamflow (fig. 5.2) has greatly impacted the transport of nutrients and sediment through the watershed and their delivery to the Bay (Langland and others, 2006). Between 1940 and 1959, the majority of annual river flow to the Bay was within the normal range (defined as the 25th to 75th percentile). A dry period occurred during the 1960s, followed by wetter conditions in the 1970s. The 15 years between 1990 and 2004 exhibited extreme variability. Since 1990, the annual nitrogen loads computed for the RIM stations have varied from 100 to over 350 million pounds with additional amounts of nitrogen being contributed from point sources and runoff from the areas not monitored at these stations (Langland and others, 2006). The combination of wetter conditions in the 1970s, along with increased nutrients and sediment from human activities, were two primary factors that caused the decline in water quality in the estuary that is still evident (Phillips and others, 2002). The findings indicate that even with reductions in nutrient and sediment concentrations, natural variability in streamflow will greatly influence the seasonal and annual delivery of loads to the estuary and influence its water quality. The CBP partners use a 3-year average of estuary water-quality data to assess attainment of water-quality standards to help address the influence of streamflow variability and loads on estuary water quality. The partners may also need to emphasize specific management actions to more effectively reduce nutrient and sediment loads from high-flow events. The flow-adjusted trend for a site is also estimated as a continuous percent change over time. Examples from three different sites are shown in figure 5.3. The pattern of change over time at a site can be used to further assess the influences of population growth and management actions in a watershed. Some watersheds continue to show downward trends in nutrients and sediment due to management actions, whereas other sites are starting to show increasing concentrations of nutrients and sediment due to continued population growth.
The USGS uses another approach, known as flow-adjusted trends, to provide an estimate of changes in nutrients due to human activities in the Bay watershed. This technique removes the influences associated with streamflow and seasonal variability to better estimate changes due to human activities. At sites where monitoring has been conducted since at least 1990, significant decreasing trends were detected at 72 percent of sites for total nitrogen (fig. 5.4), 81 percent of the sites for total phosphorous, and 43 percent of the sites for sediment (Langland and others, 2006). These results indicate that management actions are reducing the concentration of nutrients and sediment in parts of the watershed. There are multiple factors affecting the occurrence and change of nutrients over time including the natural variability in streamflow, changes in nutrient sources and land use, influence of ground water, and implementation of management actions (Sprague and others, 2000; Phillips and others, 2006). More recent USGS analysis further documented the effect that the predominant land use and changes in land-use activities over time have on nutrient concentrations and trends throughout the Chesapeake Bay watershed between 1985 and 2005. Mean concentrations of total nitrogen and total phosphorus in stream water were highest in agricultural and urbanized basins, whereas lower concentrations occurred in streams draining areas dominated by forests, wetlands, and grasslands. Reductions in point-source loads of nitrogen and phosphorous, through the phosphate detergent ban and wastewater treatment plant improvements, contributed to improving water quality in some areas of the Bay watershed. In other areas, however, increasing urban or suburban population and other factors resulted in increased point-source loads and increasing trends of nutrients at some sites. Changes in nonpoint sources, including land-use changes, implementation of nutrient management plans, and changes in fertilizer and manure application rate, were also factors affecting nutrient loads and trends in surface water throughout the Bay watershed. The implication of these findings is that reducing nutrient and sediment loads to meet the water-quality criteria in the Bay by 2010 will not be achieved. The USEPA has used these findings, and other information on the rate of implementation of management actions, to revise the expectations for load reductions that will likely occur by 2010.
ReferencesCohn, T.A., Delong, L.L., Gilroy, E.J., Hirsch, R.M., and Wells, D.K., 1989, Estimating constituent loads: Water Resources Research, v. 25, no. 5, p. 937942. Helsel, D.R., and Hirsch, R.M., 1992, Statistical methods in water resources: Amsterdam, Elsevier Science Publishers, Studies in Environmental Science, v. 49, 522 p. Hirsch, R.M., Alexander, R.B., and Smith, R.A., 1991, Selection of methods for the detection and estimation of trends in water quality: Water Resources Research, v. 27, no. 5, p. 803813. Langland, M.J., Blomquist, J.D., Sprague, L.A., and Edwards, R.E., 2000, Trends and status of flow, nutrients, and sediments for selected nontidal sites in the Chesapeake Bay watershed, 198598: U.S. Geological Survey Open-File Report 99451, 46 p. Langland, M.J., Phillips, S.W., Raffensperger, J.P., and Moyer, D.L., 2004, Changes in streamflow and water quality in selected nontidal sites in the Chesapeake Bay Basin, 19852003: U.S. Geological Survey Scientific Investigations Report 20045259, 50 p. Langland, M.J., Raffensperger, J.P., Moyer, D.L., Landwehr, J.M., and Schwarz, G.E., 2006, Changes in streamflow and water quality in selected nontidal basins in the Chesapeake Bay watershed, 19852004: U.S. Geological Survey Scientific Investigations Report 20065178, 75 p., 1 CD. Phillips, S.W., (ed.), 2002, The U.S. Geological Survey and the Chesapeake BayThe role of science in environmental restoration: U.S. Geological Survey Circular 1220, 32 p. Phillips, S.W., Lindsey, B.D., Preston, S.D., Brakebill, J.W., Raffensperger, J.P., and Shedlock, R.J., 2006, The influence of ground water and watershed processes on nutrient delivery to the Chesapeake Bay: [abs.] in Proceedings of the Joint Assembly, May 2630, 2006, Baltimore, Maryland. Sprague, L.A., Langland, M.J., Yochum, S.E., Edwards, R.E., Blomquist, J.D., Phillips, S.W., Shenk, G.W., and Preston, S.D., 2000, Factors affecting nutrient trends in major rivers of the Chesapeake Bay watershed: U.S. Geological Survey Water-Resources Investigations Report 004218, 109 p. U.S. Environmental Protection Agency, 2003, Ambient water-quality criteria for dissolved oxygen, water clarity, and chlorophyll-a for Chesapeake Bay and its tidal tributaries: Annapolis, Maryland, U.S. Environmental Protection Agency Report 903-R-03-002. | ||||||

![]() U.S. Department of the Interior |
U.S. Geological Survey
U.S. Department of the Interior |
U.S. Geological Survey
URL: http://pubsdata.usgs.gov/pubs/circ/circ1316/html/circ1316chap5.html
Page Contact Information: GS Pubs Web Contact
Page Last Modified: Tuesday, 10-Jul-2018 11:03:36 EDT