Data Series 1005
| Survey Overview and Data AcquisitionGeophysical survey data were collected during the summer of 2014 on two cruises; one cruise from July 14–29 (2014-314-FA), and one cruise from August 11–17 (2014-317-FA). The survey area encompasses approximately 356 square kilometers (km2) and extends from the shoreline of the islands approximately 5 kilometers (km) west into Breton Sound and approximately 10 km east into the Gulf of Mexico (fig. 2). Slightly more than 2,548 line-km of single-beam bathymetry (SBB), interferometric swath bathymetry (IFB), bubble gun subbottom, side-scan sonar (SSS), and chirp subbottom data were collected nearshore of Breton Island and Gosier Islands. 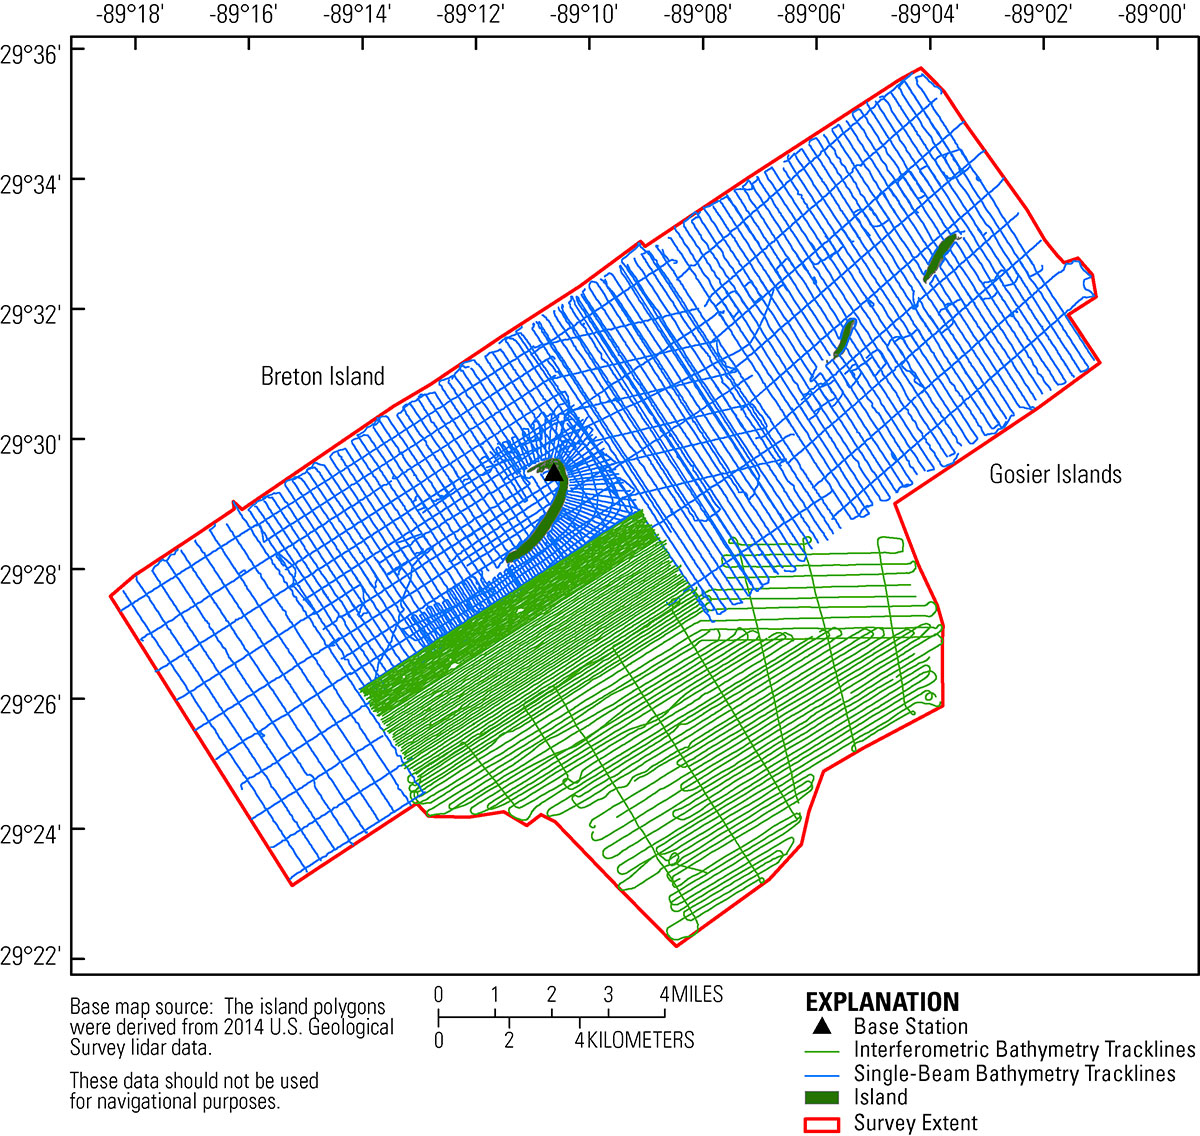 Figure 2. Trackline map overview for the 2014 Barrier Island Mapping geophysical surveys at Breton and Gosier Islands, Breton Island National Wildlife Refuge, Louisiana. Blue tracklines represent single-beam bathymetry, and green lines represent interferometric swath bathymetry. Island polygon derived from 2014 U.S. Geological Survey lidar. [Click to enlarge] The USGS FAN 2014-314-FA encompasses three sub-cruise identifiers specific to the platform used and the data type collected (14BIM01, 14BIM02, 14BIM03). The R/V Sallenger (14BIM01), a 26-foot (ft) Parker collected 426 line-km (109 lines) of interferometric swath bathymetry and bubble gun subbottom data along shore-parallel lines (fig. 3 and table 1). The SBB data were collected using two survey platforms including the R/V Jabba Jaw (14BIM02), a shallow draft 22-ft Twin Vee collected 850 line-km (170 lines), and the R/V Chum Bucket (14BIM03), a 12-ft Yamaha Personal Water Craft (PWC) collected 708 line-km (278 lines) (figs. 4 and 5; table 1). The PWC, specifically outfitted for collecting high-precision, shallow-water bathymetry, collected a substantial amount of data because it could survey at faster speeds (<5 knots (kn)) and was capable of traversing the extremely shallow-water zones (0.31–0.50 meters (m)) nearshore while capturing accurate depth measurements.
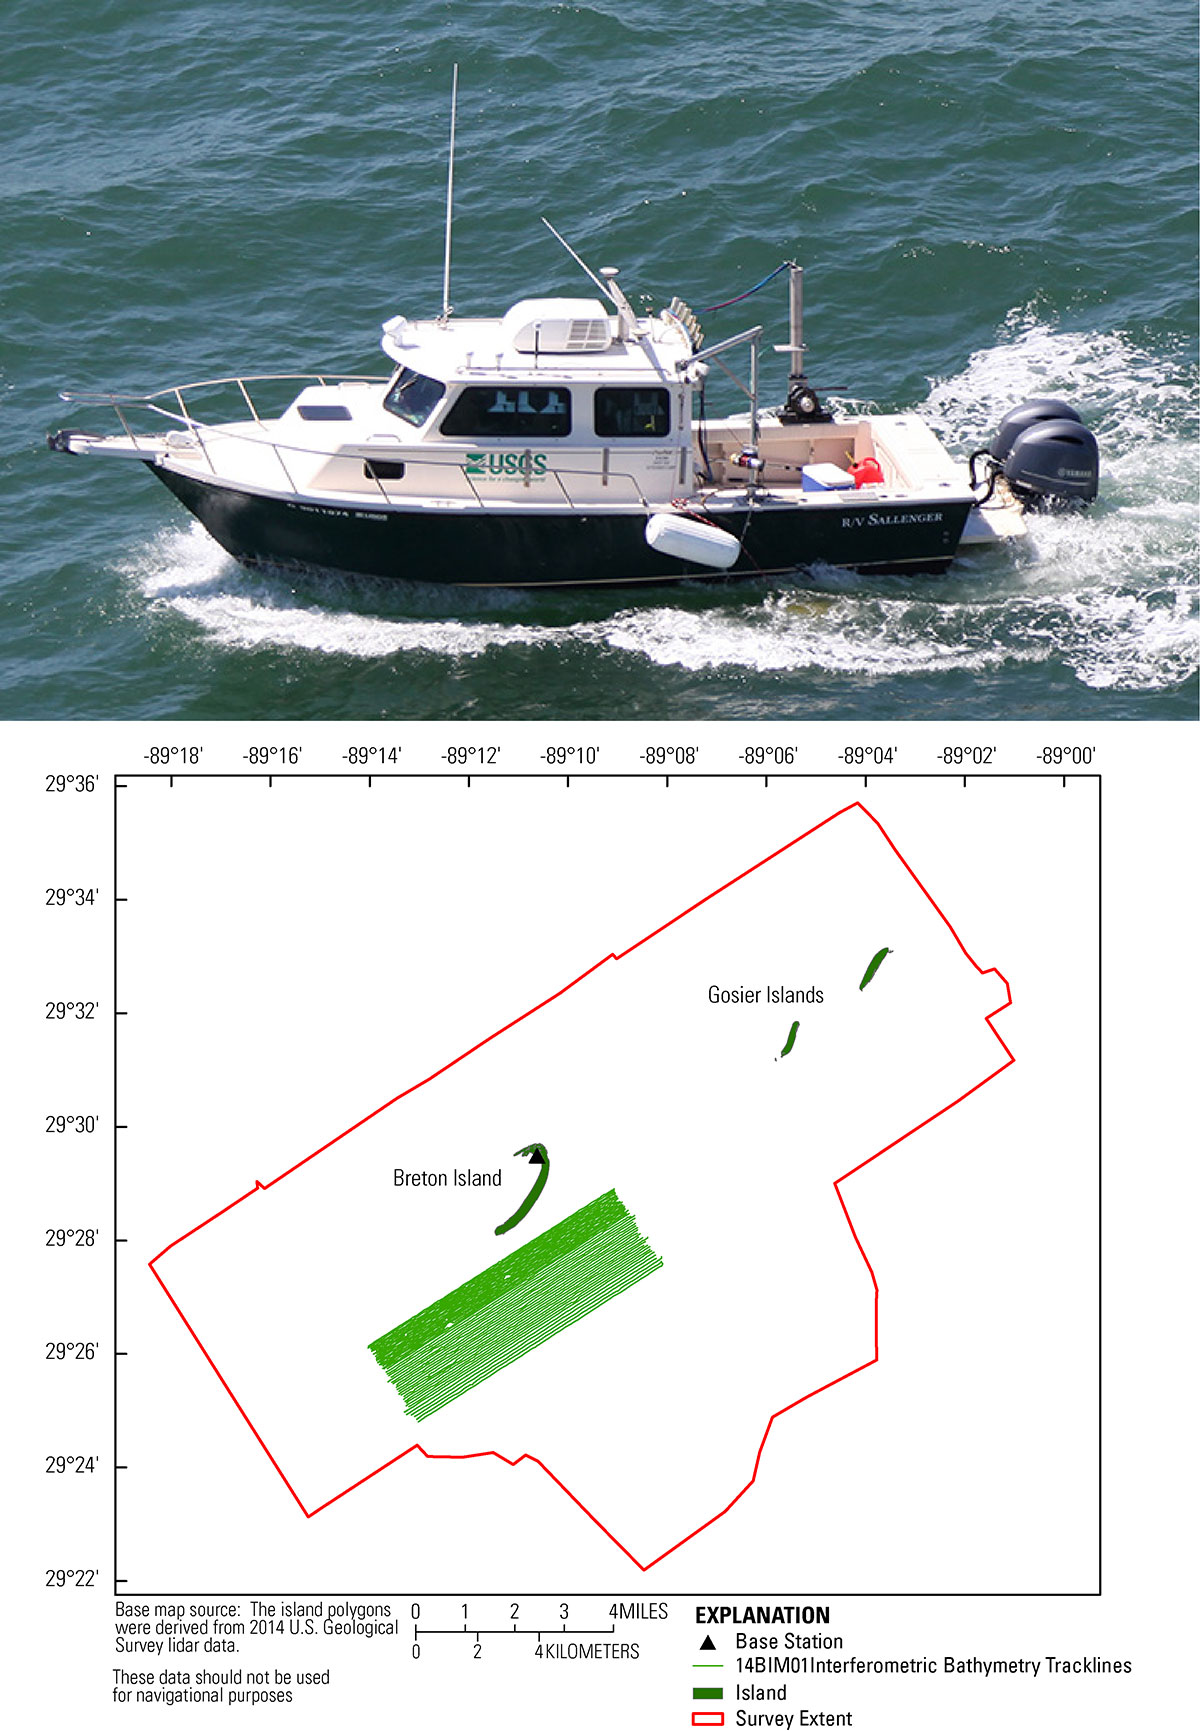 Figure 3. Photograph of the R/V Sallenger and trackline map coverage showing the 426 line-kilometers (109 lines) of interferometric swath bathymetry data collection. Island polygon derived from 2014 U.S. Geological Survey lidar. Photograph by U.S. Geological Survey Coastal and Marine Geology. [Click to enlarge]
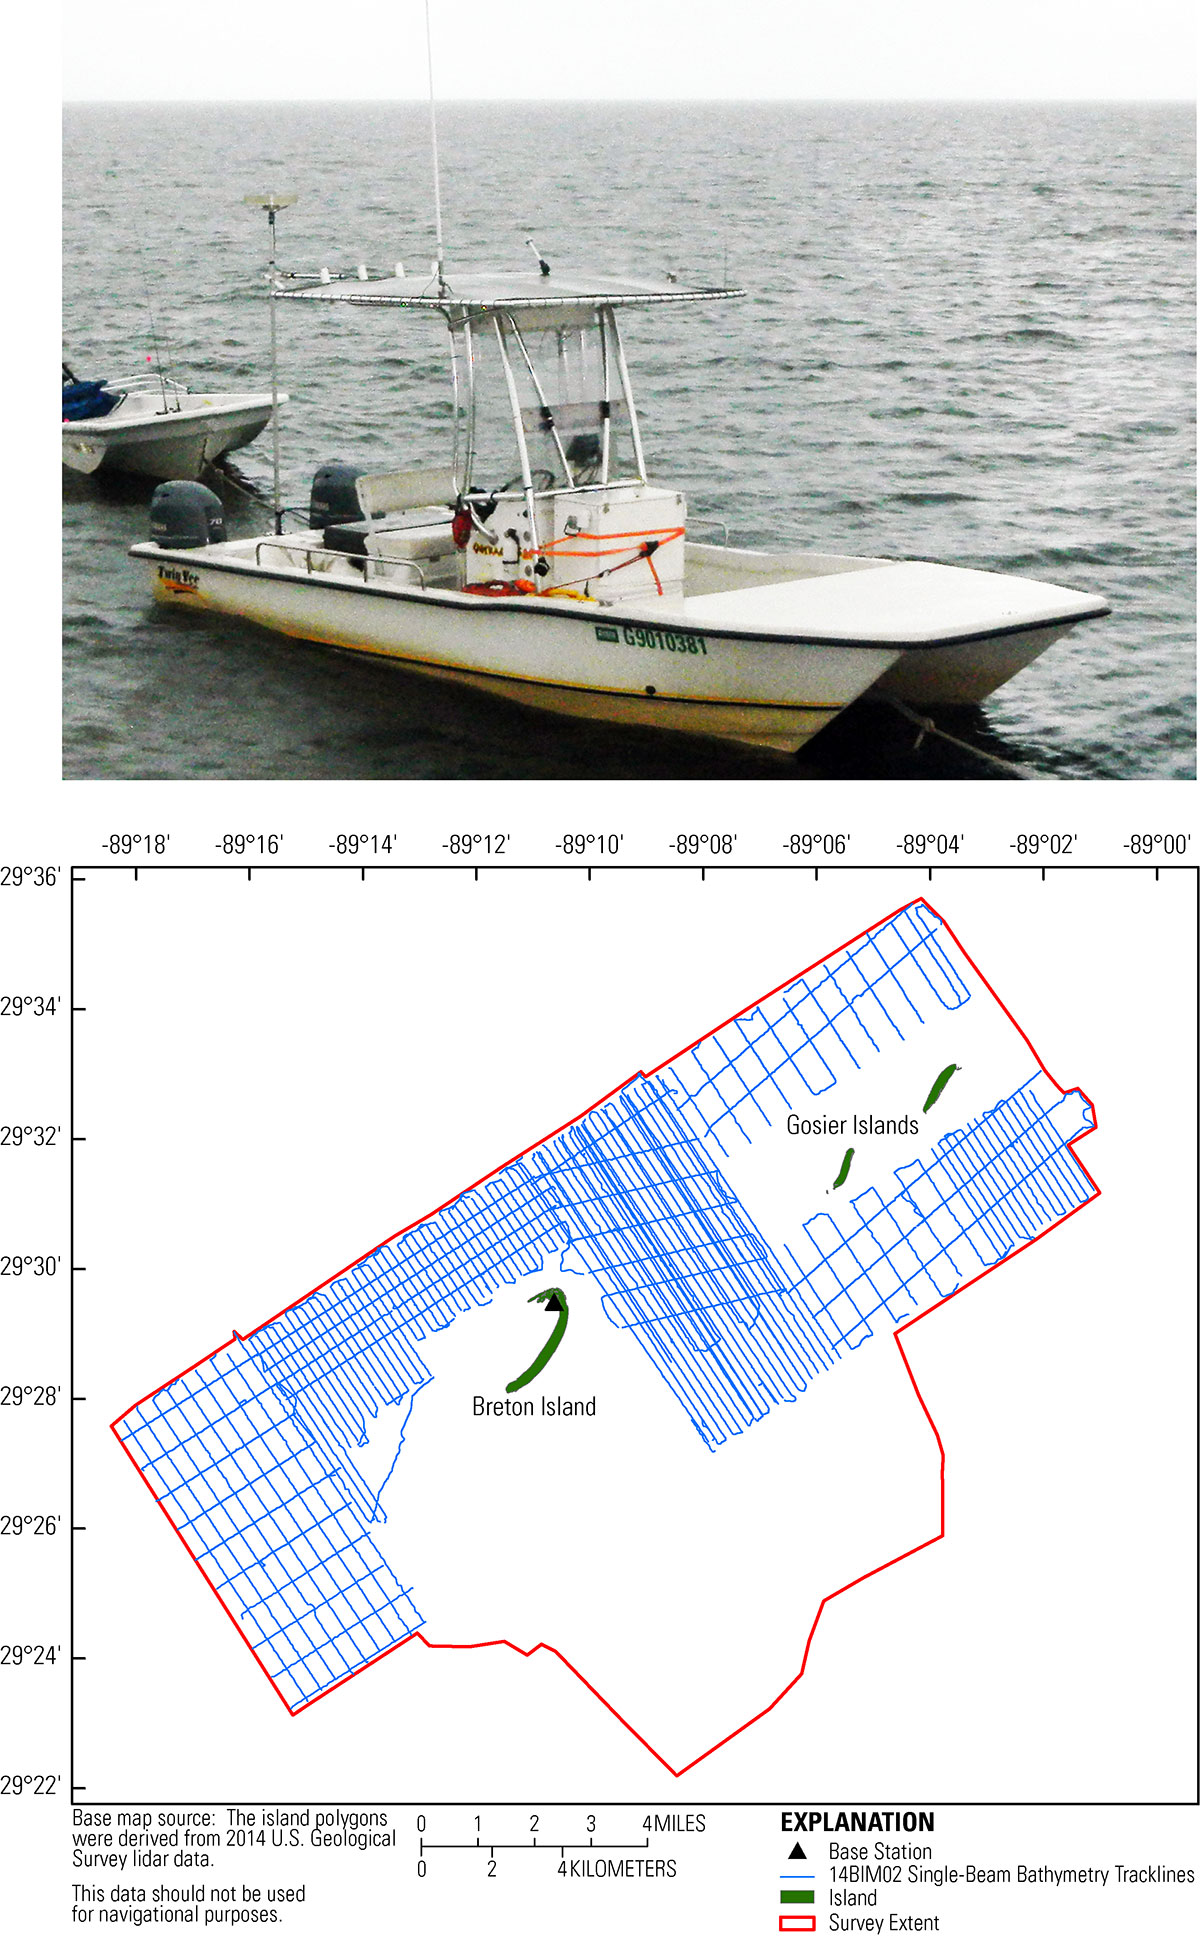 Figure 4. Photograph of the R/V Jabba Jaw and trackline map coverage showing the 850 line-kilometers (170 lines) of single-beam bathymetry data collection. Photograph by U.S. Geological Survey Coastal and Marine Geology. [Click to enlarge]
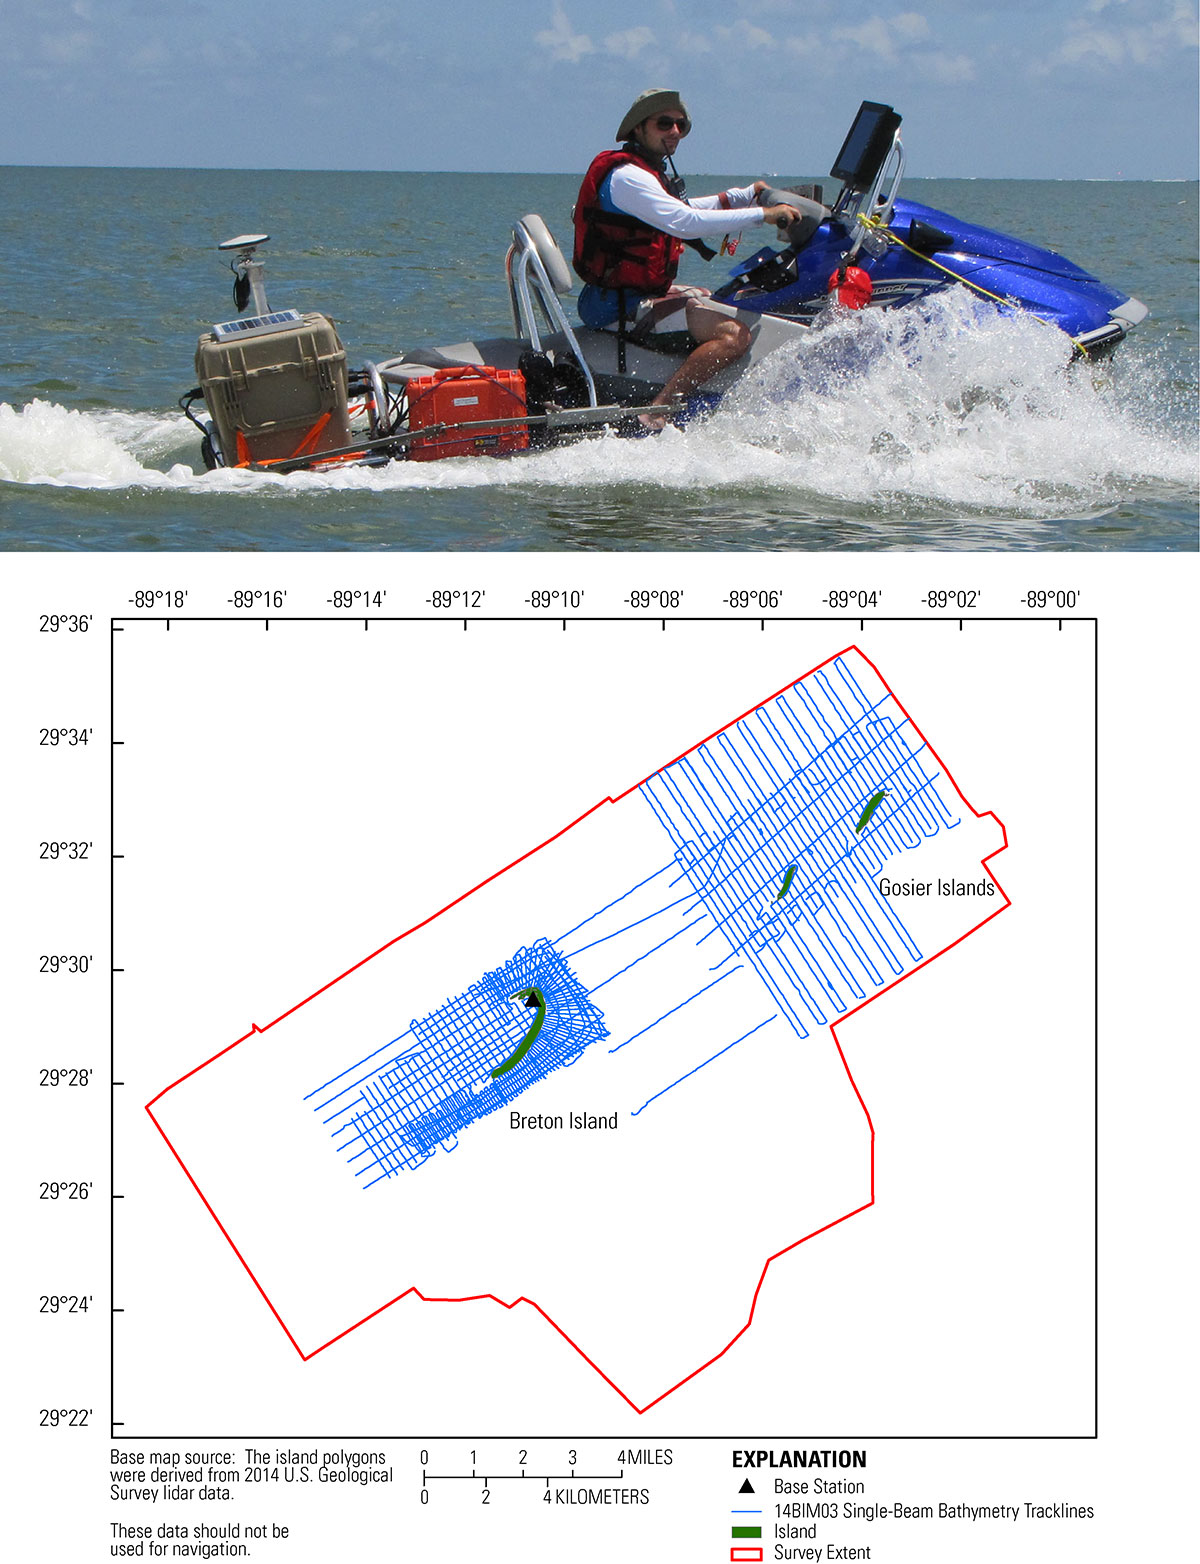 Figure 5. Photograph of the R/V Chum Bucket and trackline map coverage showing the 708 line-kilometers (278 lines) of single-beam bathymetry data collection. Island polygon derived from 2014 U.S. Geological lidar. Photograph by U.S. Geological Survey Coastal and Marine Geology. [Click to enlarge] The USGS FAN 2014-317-FA had one sub-cruise identifier. The 97-ft R/V Tommy Munro (14BIM05) collected 565 line-km (89 lines) (fig. 6 and table 1) using an interferometric swath bathymetry system, a side-scan sonar system that imaged the seafloor's surface (this report), and a high-resolution chirp subbottom profiler that imaged the shallow subbottom. This vessel provided a stable platform and 24-hour survey operations extending survey coverage farther offshore and into deeper open waters.
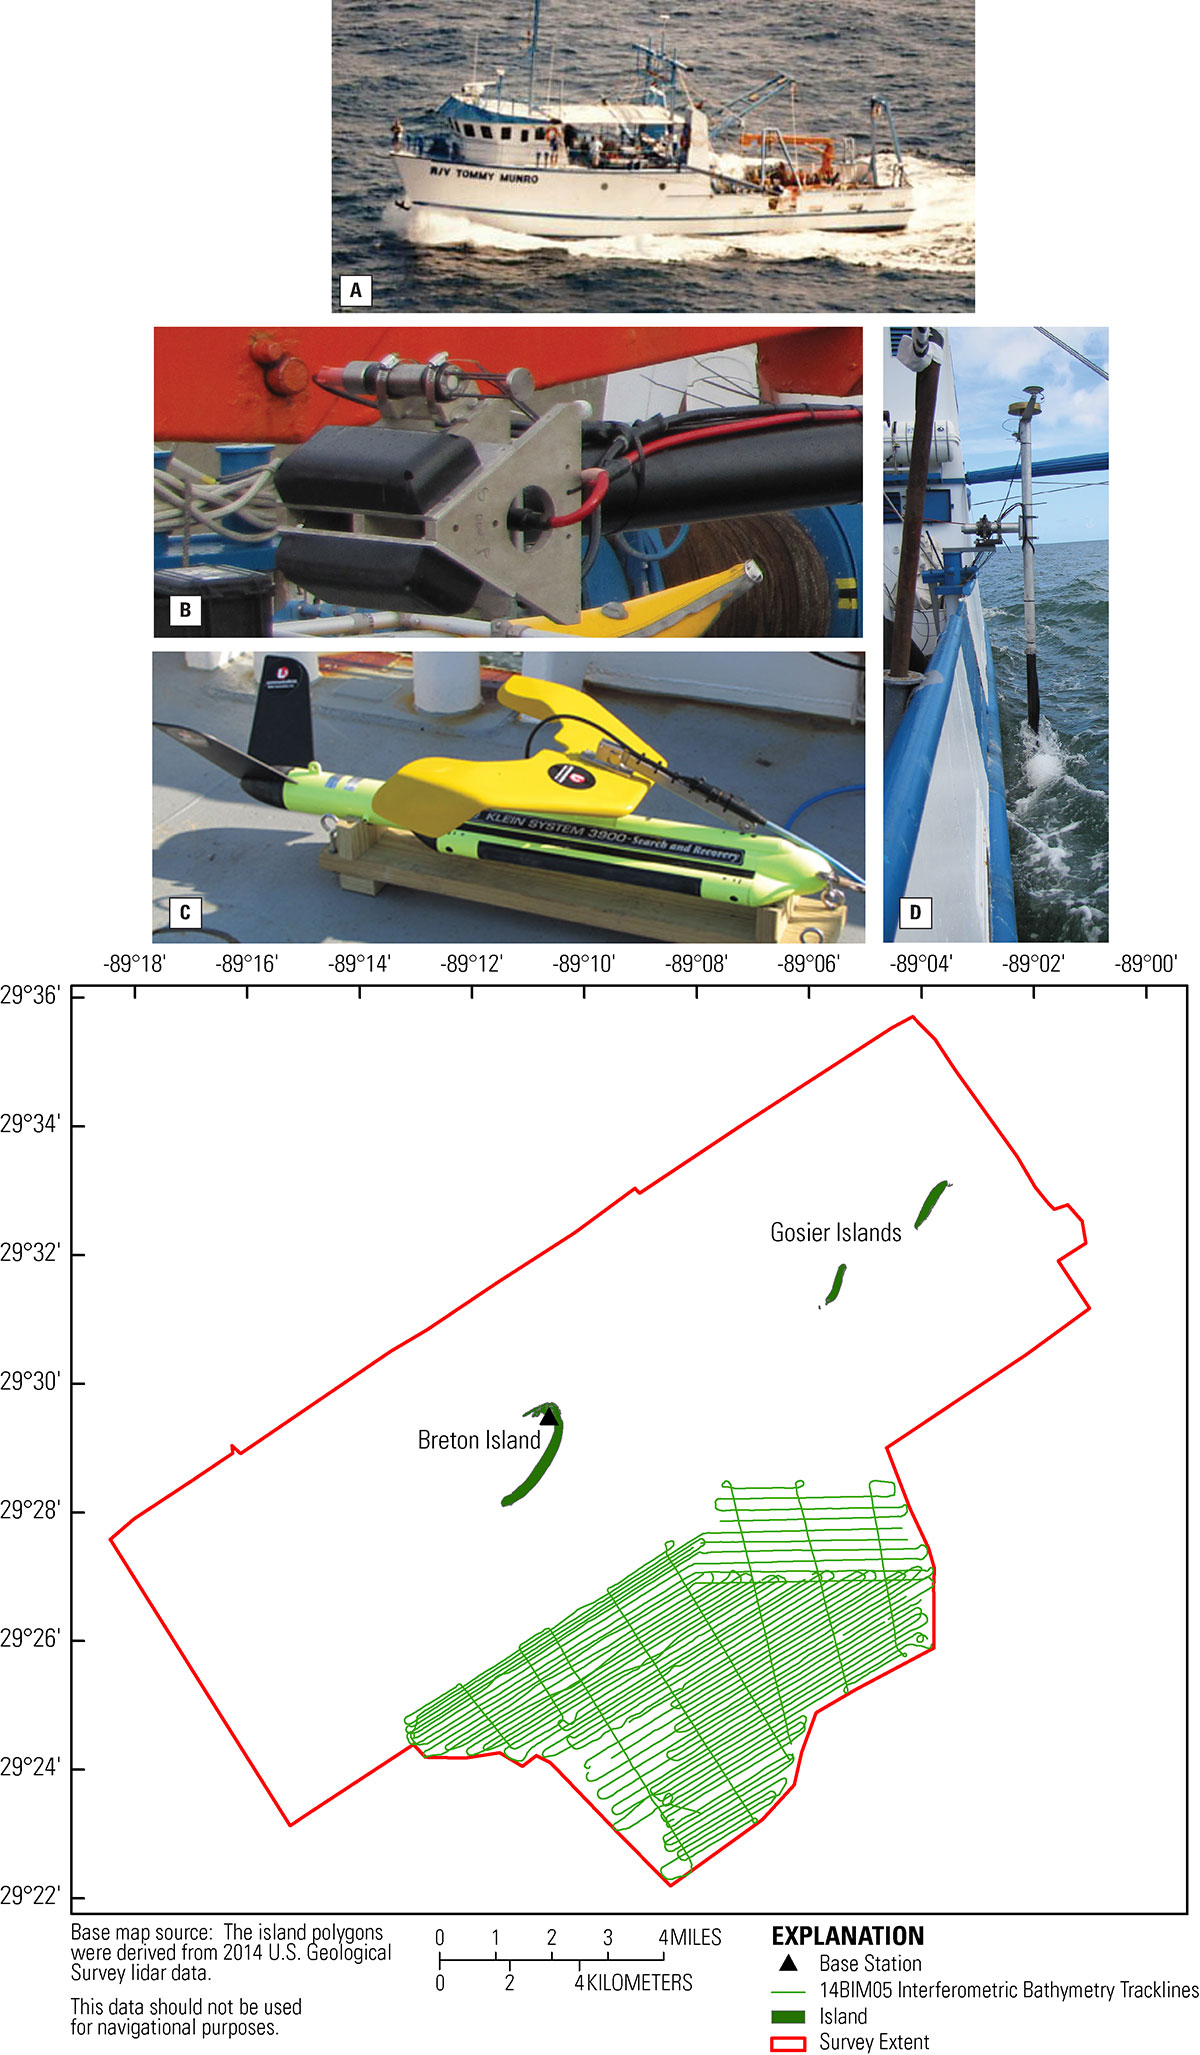 Figure 6. Photograph of the R/V Tommy Munro and trackline map coverage showing the 565 line-kilometers (89 lines) of interferometric swath, side-scan sonar, and a high-resolution chirp subbottom data collection. The research vessel (A) was mobilized with (B) the interferometric swath bathymetry equipment including the swath transducers, sound-velocity sensor, and Internal Measurement Unit wet pod attached to the base of the rigid pole mount, (C) the Klein 3900 side-scan sonar towfish, and (D) the pole mount deployed with Global Positioning System navigation bracket affixed. Island polygon derived from 2014 U.S. Geological Survey lidar. Photograph of R/V Tommy Munro (A) by University of Southern Mississippi Gulf Coast Research Laboratory. Photograph of instruments (B-D) by U.S. Geological Survey Coastal and Marine Geology. [Click to enlarge] All the bathymetric data (IFB and SBB) in this data series were merged with a Light Detection and Ranging (lidar) dataset collected in 2014 to create a seamless digital elevation model (DEM) of the survey area. Detailed information for the lidar data can be found in the USGS data release (Terrano, Smith, and Flocks, 2016). The North American Vertical Datum of 1988 (NAVD88) orthometric elevation range for all of the bathymetry and lidar data is from +1.957 m to -10.644 m, derived from the National Geodetic Survey's (NGS) geoid model of 2009 (GEOID09).
Table 1. Summary of the U.S. Geological Survey field activity numbers (FAN) with their respective sub-cruise identifiers, listing the vessel platform, data type collected, total trackline count, and total trackline length surveyed. Lengths are in kilometers (km).
Data AcquisitionSingle-Beam BathymetryNavigationA Global Positioning System (GPS) base station (BRET) was assembled at a previously installed USGS benchmark, located on a shell hash flat on the northwest end of Breton Island. A second base station (BRT2) was temporarily installed atop a short piling located 0.40 km southwest of BRET to serve as a backup base station. The Ashtech ProFlex GPS receivers (table 2) recorded the 12-channel full-carrier-phase positioning signals (L1/L2) from satellites via the Thales choke-ring antennas. A similar GPS instrument combination was duplicated on the survey vessels and is referred to as the rover. The base receivers and the rover receivers recorded their positions concurrently with the same time intervals (1.0 second (s) for 14BIM02 and 0.1 s for 14BIM03) throughout the survey. HYPACK, a marine surveying, positioning, and navigation software package, managed the planned line information and provided real-time navigation and instrumentation-status information to the boat operator (HYPACK version 14.0.9.47 for 14BIM02 and version 13.0.09.17 for 14BIM03 respectively). Soundings and MotionDepth soundings were acquired aboard the R/V Jabba Jaw and the R/V Chum Bucket at 50-millisecond (ms) intervals using an Odom CV100 echosounder system with a 200-kilohertz (kHz) transducer (fig. 4 and table 3). Boat motion was recorded on the R/V Jabba Jaw at 50-ms intervals using a Teledyne TSS Dynamic Motion Sensor (TSS DMS-05) (table 4). The R/V Chum Bucket did not record boat motion. To minimize motion errors, the R/V Chum Bucket recorded GPS at a high rate (0.1 s) using the Ashtech ProFlex 800 GPS receiver, and used a short antenna (lever-arm), in combination with a narrow (4-degree) transducer beam. All sensor data were saved as a single raw data file (.raw) in HYPACK, with each device string referenced by a device identification code and time stamped in Coordinated Universal Time (UTC). Sound VelocitySound velocity profile (SVP) measurements were collected using a SonTek Castaway Conductivity, Temperature, and Depth (CTD) instrument (table 5). The instrument was periodically cast overboard to measure changes in water column speed of sound (SOS). The recorded profiles were incorporated into the post-processing software to correct the depth for temporal and spatial SOS changes throughout the water column.
Table 2. Specifications for the Ashtech Z-Xtreme, ProFlex 500, and ProFlex 800 GPS receivers used during the single-beam bathymetry survey, Ashtech_ZXtreme (194-KB PDF), Ashtech_ProFlex500 (228-KB PDF), Ashtech_ProFlex800 (194-KB PDF).
Table 3. Specifications for the ODOM CV100 Echosounder used during the single-beam bathymetry survey, Odom_Echotrac_CV100 (116-KB PDF). Vertical accuracy listed in centimeters (cm) and meters (m).
Table 4. Specifications for the Teledyne TSS-DMS-05 motion sensor used during the single-beam bathymetry survey, TSS-DMS-05 (202-KB PDF).
Table 5. Specifications for the SonTek CastAway CTD profiler used during the single-beam bathymetry survey, CastAway-CTD (520-KB PDF). Measurements are expressed in meters per second (m/s).
Interferometric Swath BathymetryNavigation and MotionPosition data recorded by the Coda-Octopus F190R IMU (inertial measurement unit) system were corrected in real-time with the Marinestar HP differential navigation service provided through Fugro (table 6). The IMU also applied real-time motion corrections for heave, roll, and pitch to the vertical component of each position fix. The F190R software program accounted for equipment offsets, and a calibration was performed every day of the survey. The corrected positions from the F190R were integrated with the observed bathymetric values to calculate a final position and ellipsoid height representing the elevation of the seafloor with respect to the geodetic reference frame ITRF2005 (ITRF05) across the swath range. Planned survey tracklines were loaded into HYPACK as a navigation guide for the boat operator (version 14.0.9.47 for 14BIM01 14BIM05). SoundingsThe interferometric swath bathymetry data were collected aboard the R/V Sallenger and the R/V Tommy Munro using a 468-kHz Systems Engineering and Assessment Ltd. (SEA), Swathplus-H (high frequency) interferometric sonar system (table 7). Swathplus serves as both acquisition software and initial processing software. Preliminary roll calibration trackline data were collected and processed using SEA Swathplus version 3.10.2.0 and Grid Processor software version 3.10.0.0. Instrument offsets and calibration values were entered into the session files (.sxs), and the raw data files (.sxr) were then processed using the updated session file. These values included roll calibration values, measured equipment offsets, acquisition parameters, navigation and motion data from the F190R, SOS data at the sonar head, and SVP cast data. Any calibration offsets and acoustic filtering utilized in Swathplus is applied to each raw data file to create a processed data file (.sxp) that is imported into the advanced sounding data processing software CARIS HIPS and SIPS. The initial real-time processing datum for the swath and backscatter data is ITRF05, which is the acquisition datum for Marinestar HP position and navigation data. Sound VelocityAccurate SOS values throughout the water column are essential for accurate seafloor mapping with an interferometric swath system, particularly at swath beam range extents. If SOS is inaccurate, water column refraction significantly decreases data precision and accuracy throughout the beam range of the swath system, particularly at the far range, thereby increasing manual post-survey processing time and interpolation uncertainty upon creation of a DEM. A Valeport Mini Sound Velocity Sensor (SVS) was attached to the transducer mount and used to collect continuous SOS measurements at the depth of the transducers. These values were directly read and incorporated into the Swathplus acquisition software, giving real-time SOS at the transducer head while underway (table 8). Also, a separate Valeport miniSVP was used to collect SOS profiles (water surface to seafloor) at strategic intervals throughout the survey (table 9). The SOS profiles collected throughout both IFB survey areas revealed significant variability spatially along the tracklines and vertically with depth. The swath profile was closely monitored during acquisition, and anytime refraction was detected in the profile an SOS profile cast was taken to compensate for this variability. Side-Scan SonarSide-scan sonar is used to detect seabed features along with sediment composition and textures from acoustic backscatter intensity. In this application, a Klein 3900 towfish was towed by a cable aft of the vessel and data were recorded using SonarPro version 12.1. Once activated, a fan-shaped acoustic pulse is repeatedly emitted downward to the seafloor, perpendicular to a vessel's navigation track, collecting a series of swaths stitched together to create a sonogram, or seafloor image. The towfish can be operated over a range of frequencies; lower frequencies are recorded at a lower resolution, but increasing swath range and higher frequencies are recorded with high resolution at the cost of swath range. High-intensity returns are indications of increased grain size and (or) hard or dense surface material, such as rock or hard-packed sand, whereas low-intensity returns may infer silt or organic material. Intensity images are used in conjunction with physical “grab” samples or cores for the purpose of ground truthing the side-scan sonar mosaic.
Table 6. Specifications for the Coda Octopus F190R inertial measurement unit (IMU) used during the interferometric swath bathymetry survey, Coda Octopus Group, Inc., F180 Series (1.84-MB PDF). Measurements are expressed in meters (m), meters per second (m/s), centimeters (cm), and seconds (s).
Table 7. Specifications for the Swathplus-H sonar system (SEA Ltd.) transducers used to collect interferometric swath bathymetry data during the survey, Swathplus (175-KB PDF). Measurements are expressed in meters (m), centimeters (cm), and microseconds (μSEC).
Table 8. Specifications for the Valeport MiniSVS used to collect continuous sound velocity, co-located with the bathymetry transducers and IMU, Valeport_miniSVS (148-KB PDF). Measurements are expressed in millimeters (mm), meters per second (m/s) and Hertz (Hz).
Table 9. Specifications for the Valeport Mini SVP used to collect positional sound velocity profiles through the water column, Valeport_miniSVP (135-KB PDF). Measurements are expressed in millimeters (mm), meters per second (m/s), Celsius (°C), and Hertz (Hz).
Note: To view PDF documents the latest version of Adobe Reader or similar software is required. Disclaimer: Any use of trade names is for descriptive purposes only and does not imply endorsement by the U.S. Government. |
|||||||||||||||||||||||||||||||||||||||||||||||||||||||||||||||||||||||||||||||||||||||||||||||||||||||||||||||||||||||||||||||||||||||||||||||

![]() U.S. Department of the Interior |
U.S. Geological Survey
U.S. Department of the Interior |
U.S. Geological Survey
URL: http://pubsdata.usgs.gov/pubs/ds/1005/ds1005-overview.html
Page Contact Information: GS Pubs Web Contact
Page Last Modified: Monday, 28-Nov-2016 20:51:12 EST
