| Tracklines |
Bathymetry |
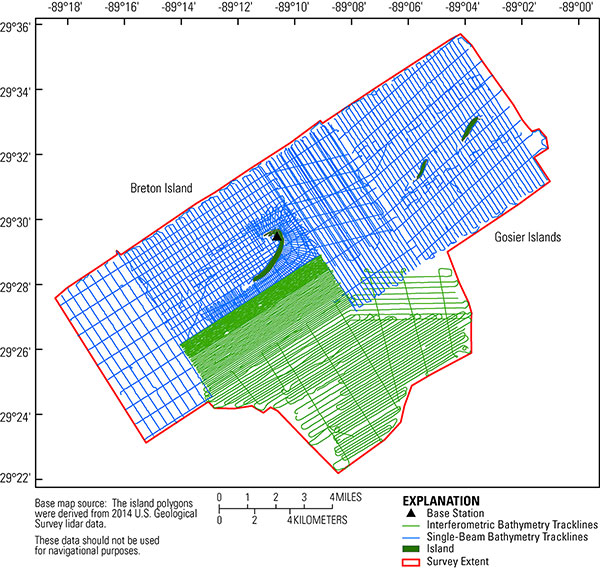
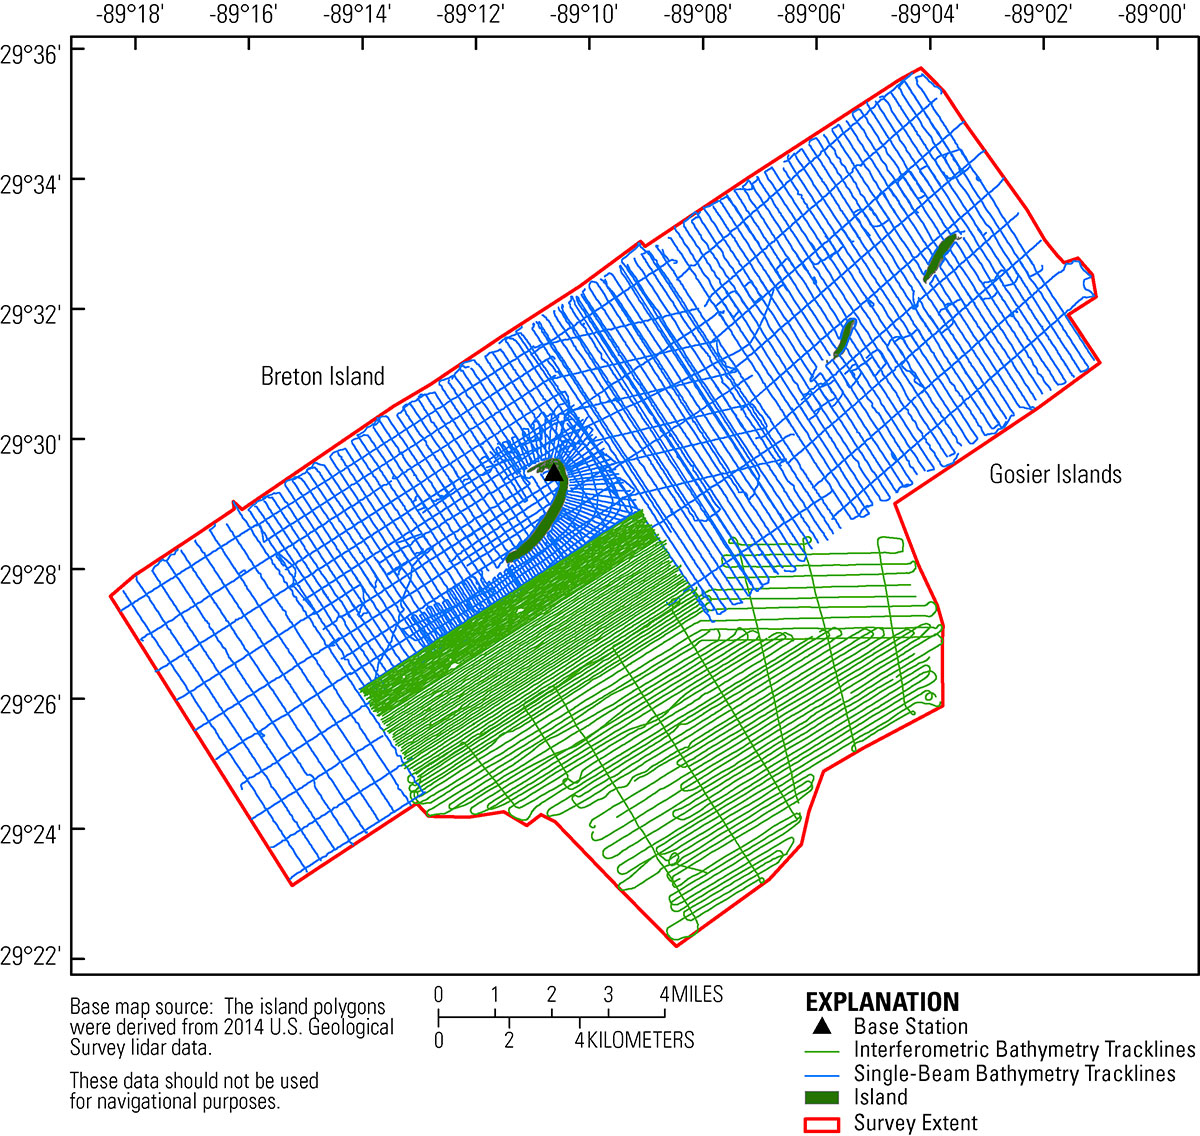
Figure 2. Trackline map overview for the 2014 Barrier Island Mapping geophysical surveys at Breton and Gosier Islands, Breton Island National Wildlife Refuge, Louisiana. Blue tracklines represent single-beam bathymetry, and green lines represent interferometric swath bathymetry. Island polygon is derived from 2014 U.S. Geological Survey lidar. [Click to enlarge] |

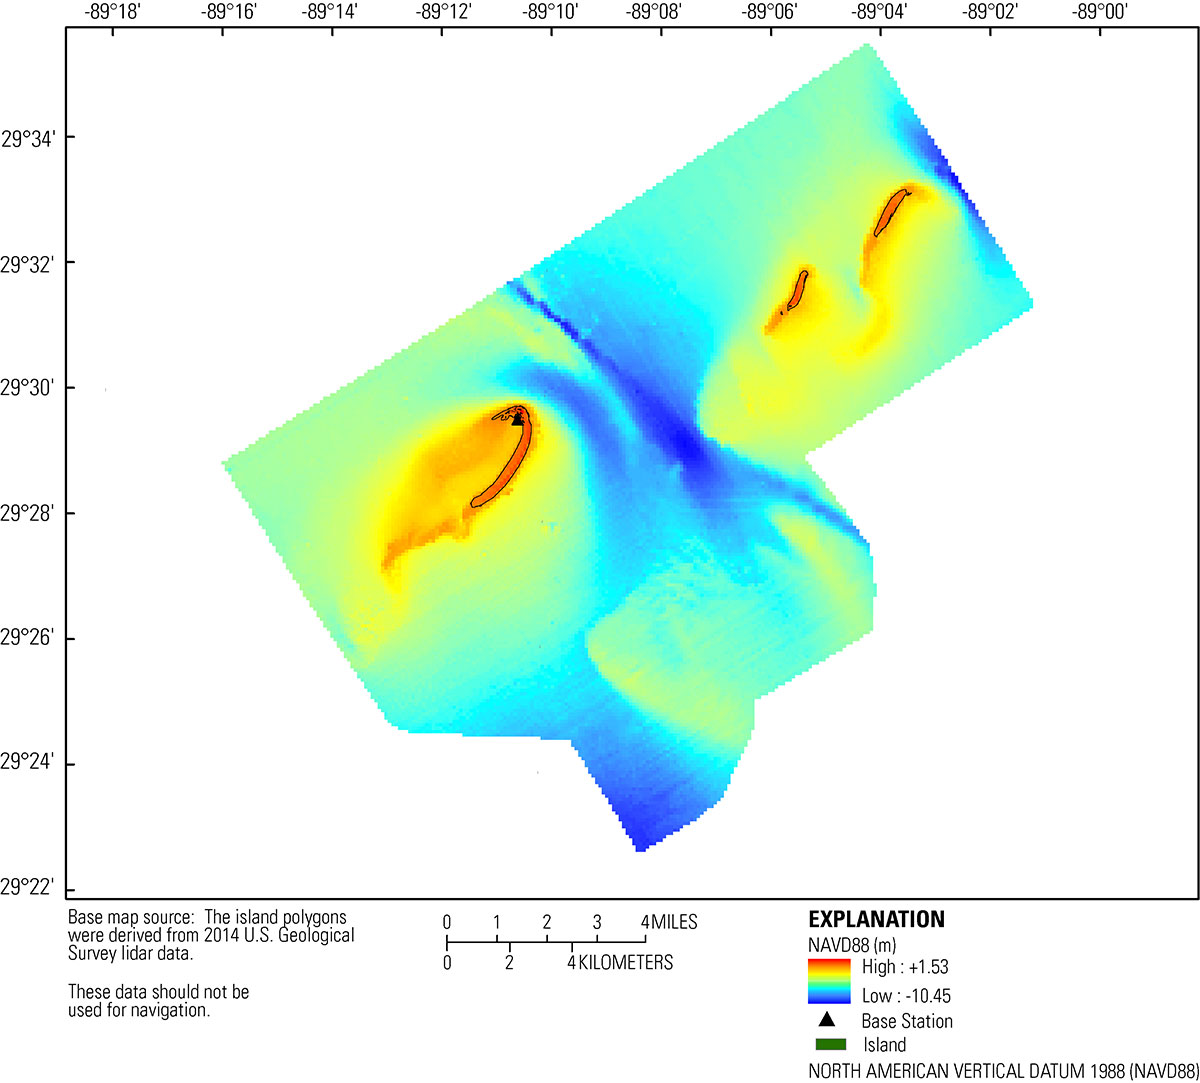
Figure 8. The 100-meter digital elevation model for the 2014 Barrier Island Mapping at Breton and Gosier Islands, Breton Island National Wildlife Refuge, Louisiana. Horizontal data are referenced to North American Vertical Datum of 1983 Universal Transverse Mercator (UTM) Zone 16 North and the vertical data are referenced to North American Vertical Datum 1988 with respect to GEOID09. [Click to enlarge] |
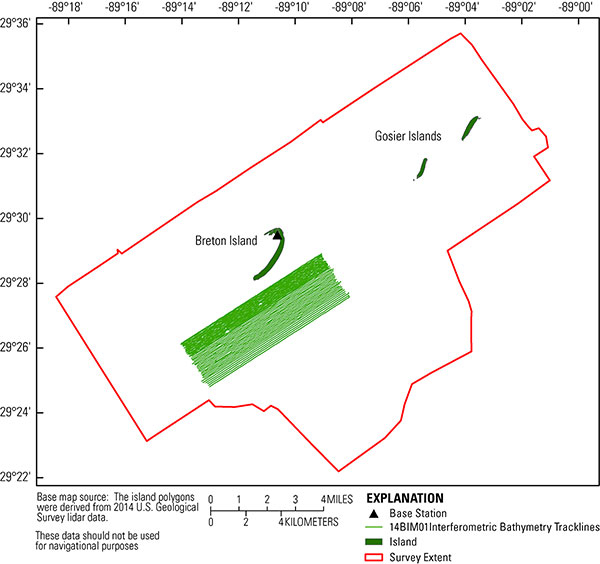
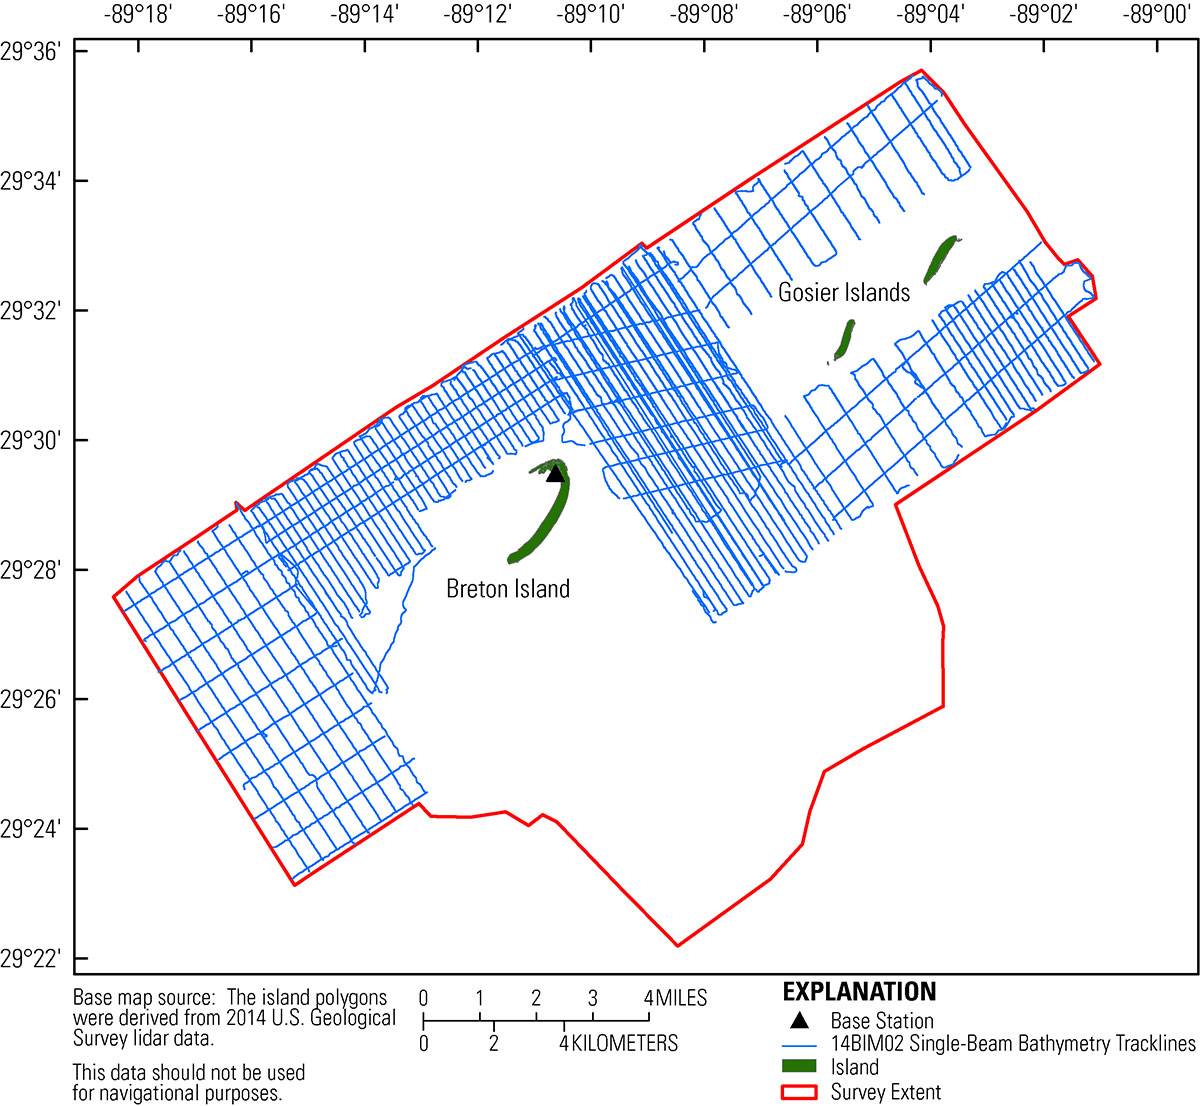
Figure 11. Trackline map of the R/V Sallenger showing the 426 line-kilometers (109 lines) of single-beam bathymetry data collection. Island polygon is derived from 2014 U.S. Geological Survey lidar. [Click to enlarge] |
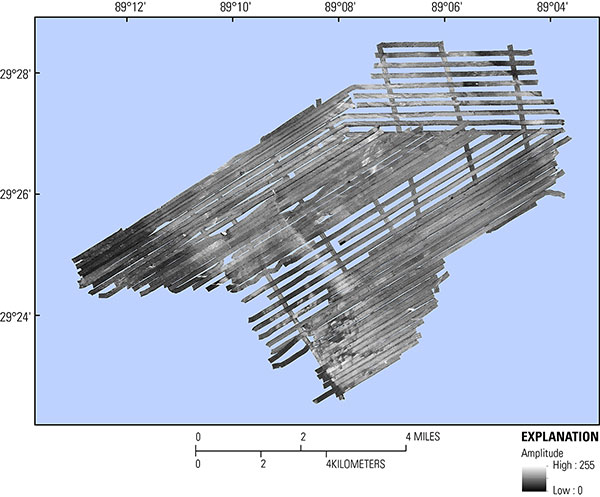
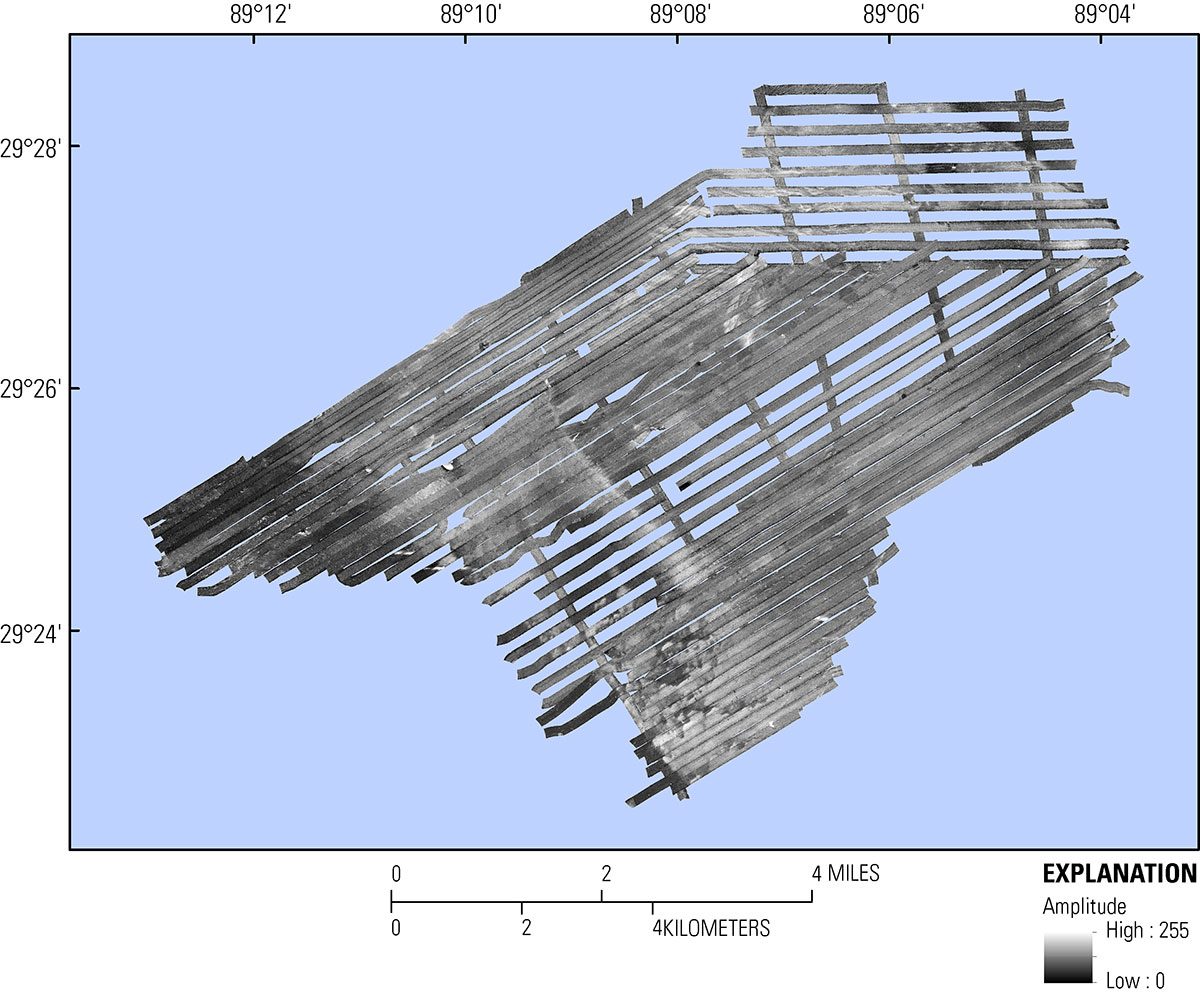
Figure 7. Side-scan sonar acoustic backscatter from the Klein 3900. [Click to enlarge] |
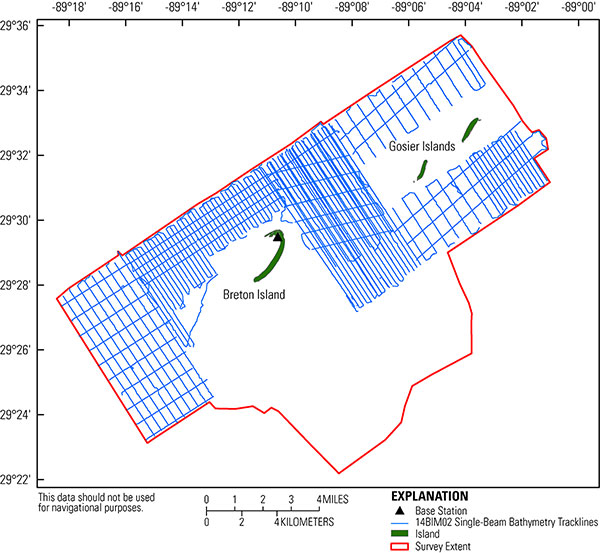
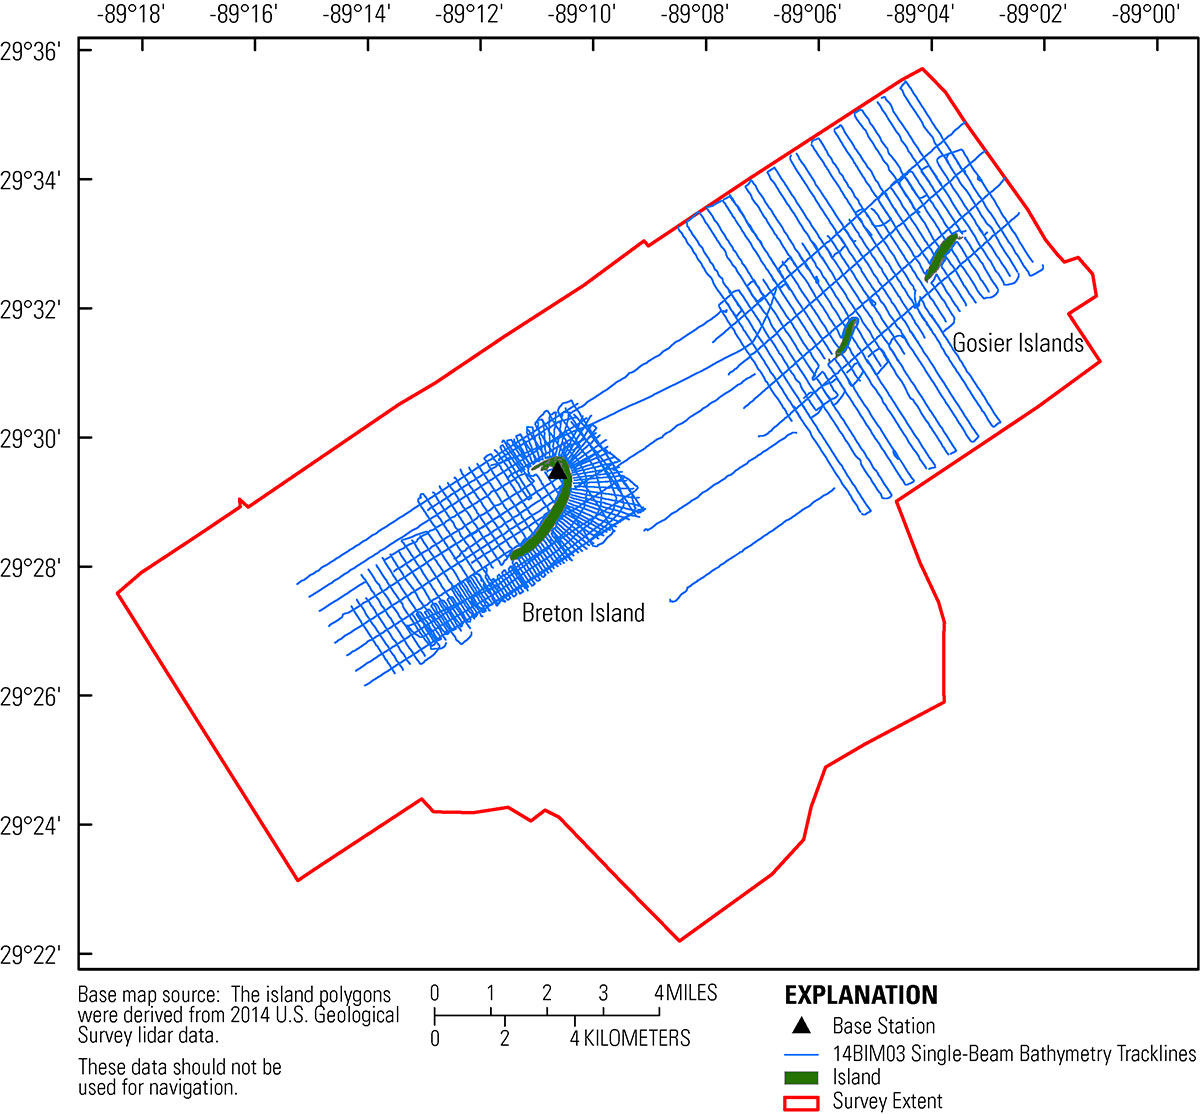
Figure 12. Trackline map of the R/V Jabba Jaw showing the 850 line-kilometers (170 lines) of single-beam bathymetry data collection. Island polygon is derived from 2014 U.S. Geological Survey lidar. [Click to enlarge] |
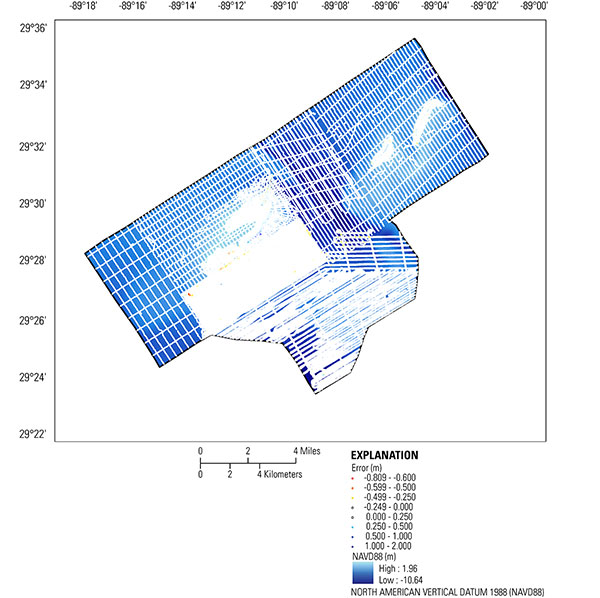
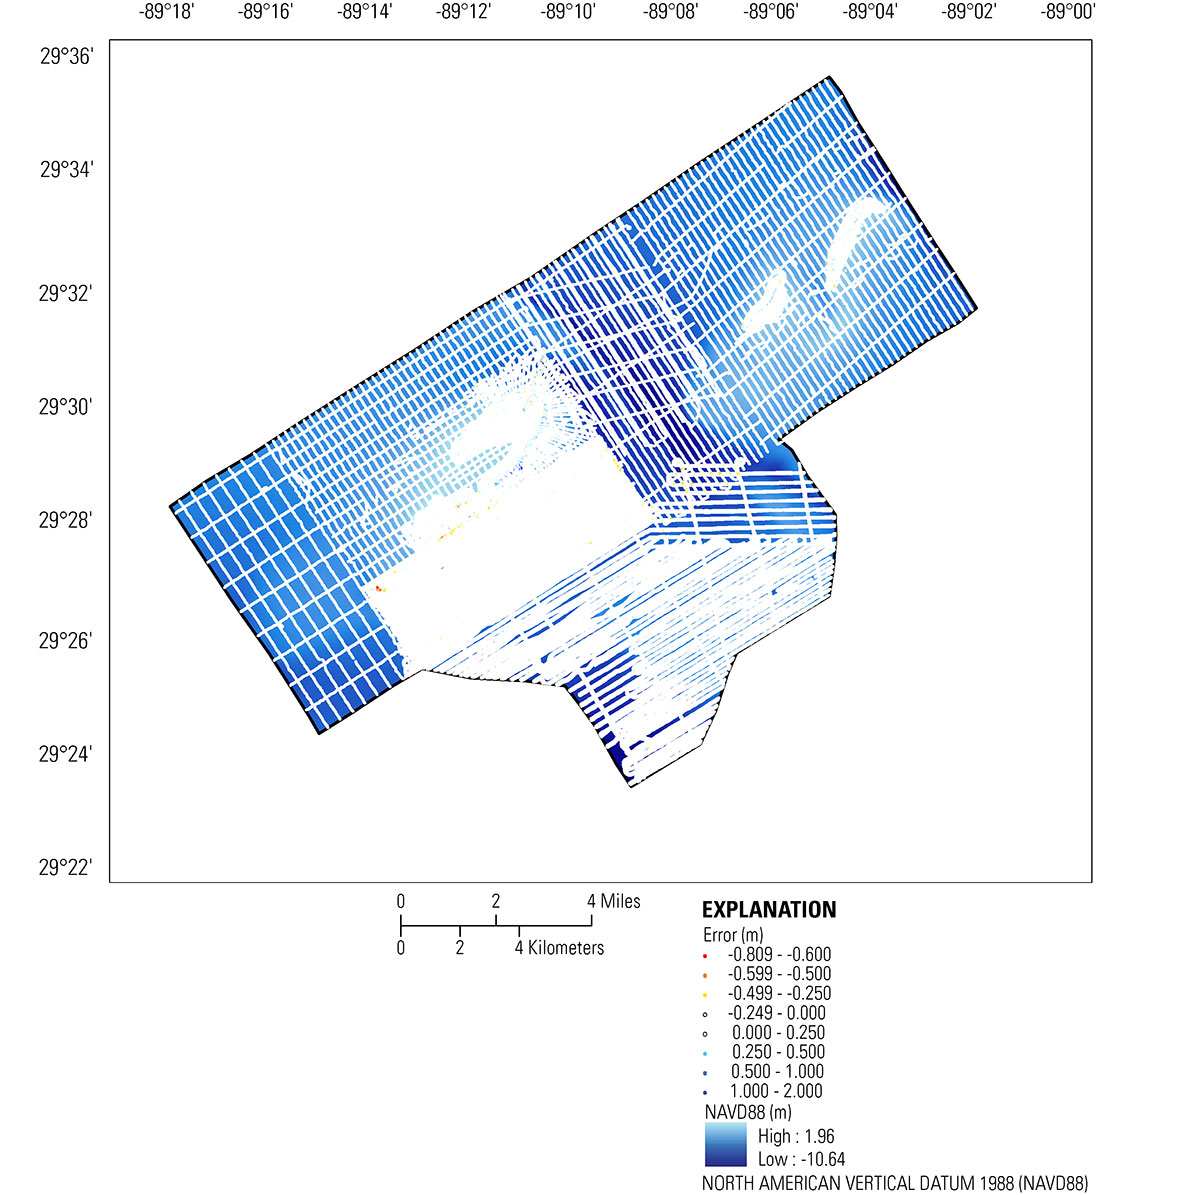
Figure 9. Error values representing the difference between the digital elevation model and the value at each sample point. White symbols represent acceptable system error of ±0.250 meters. [Click to enlarge] |
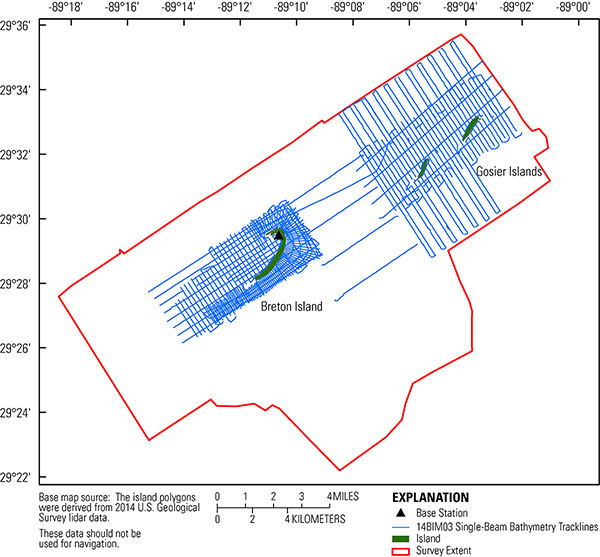
Figure 13. Trackline map of the R/V Chum Bucket showing the 708 line-kilometers (278 lines) of single-beam bathymetry data collection. Island polygon is derived from 2014 U.S. Geological Survey lidar. [Click to enlarge] |
|

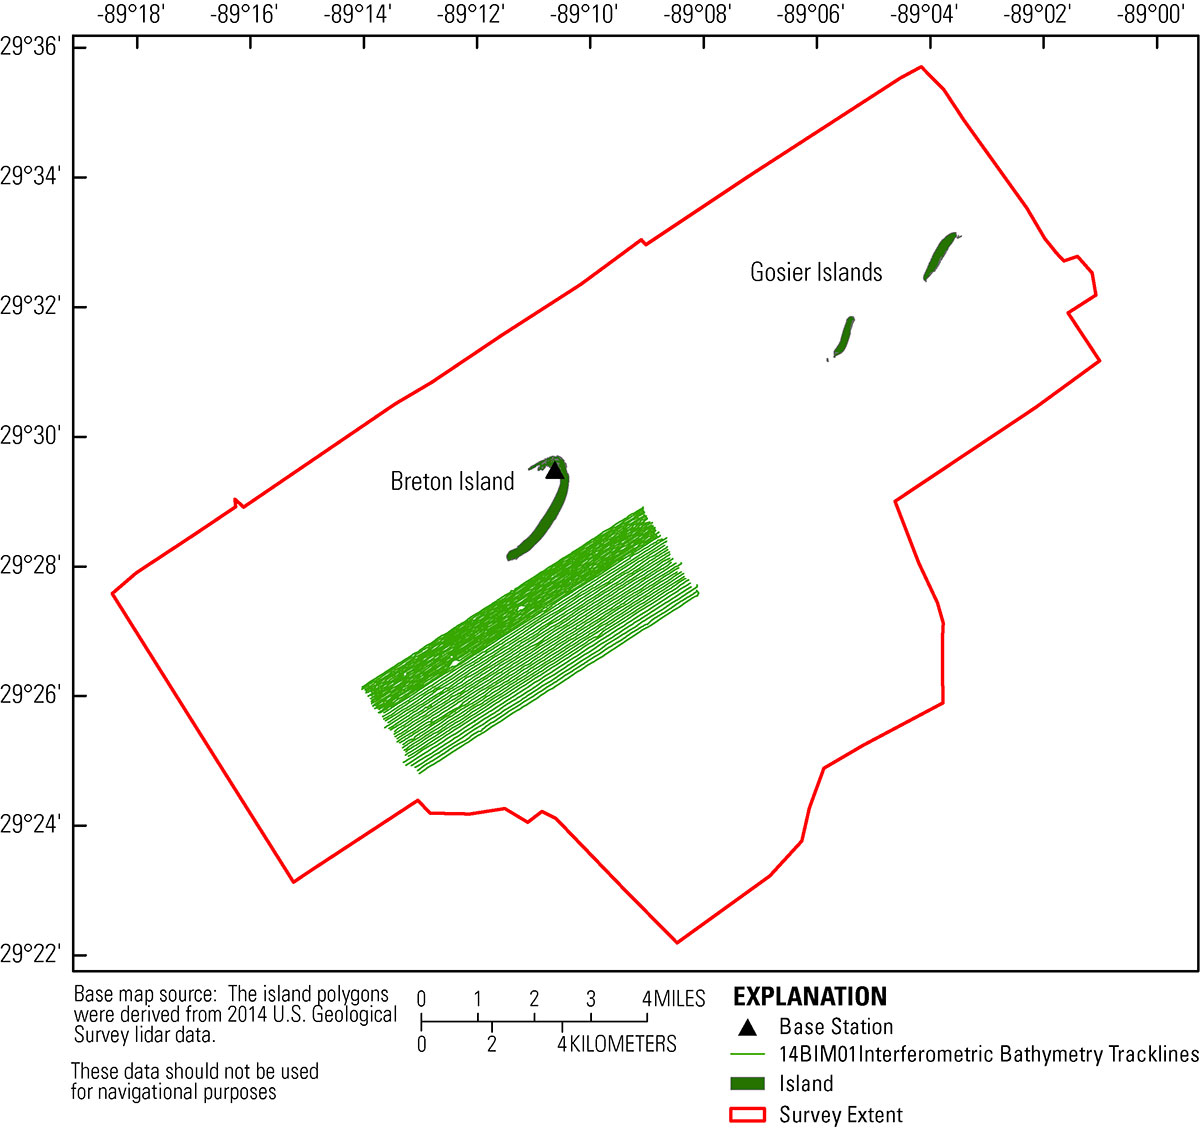
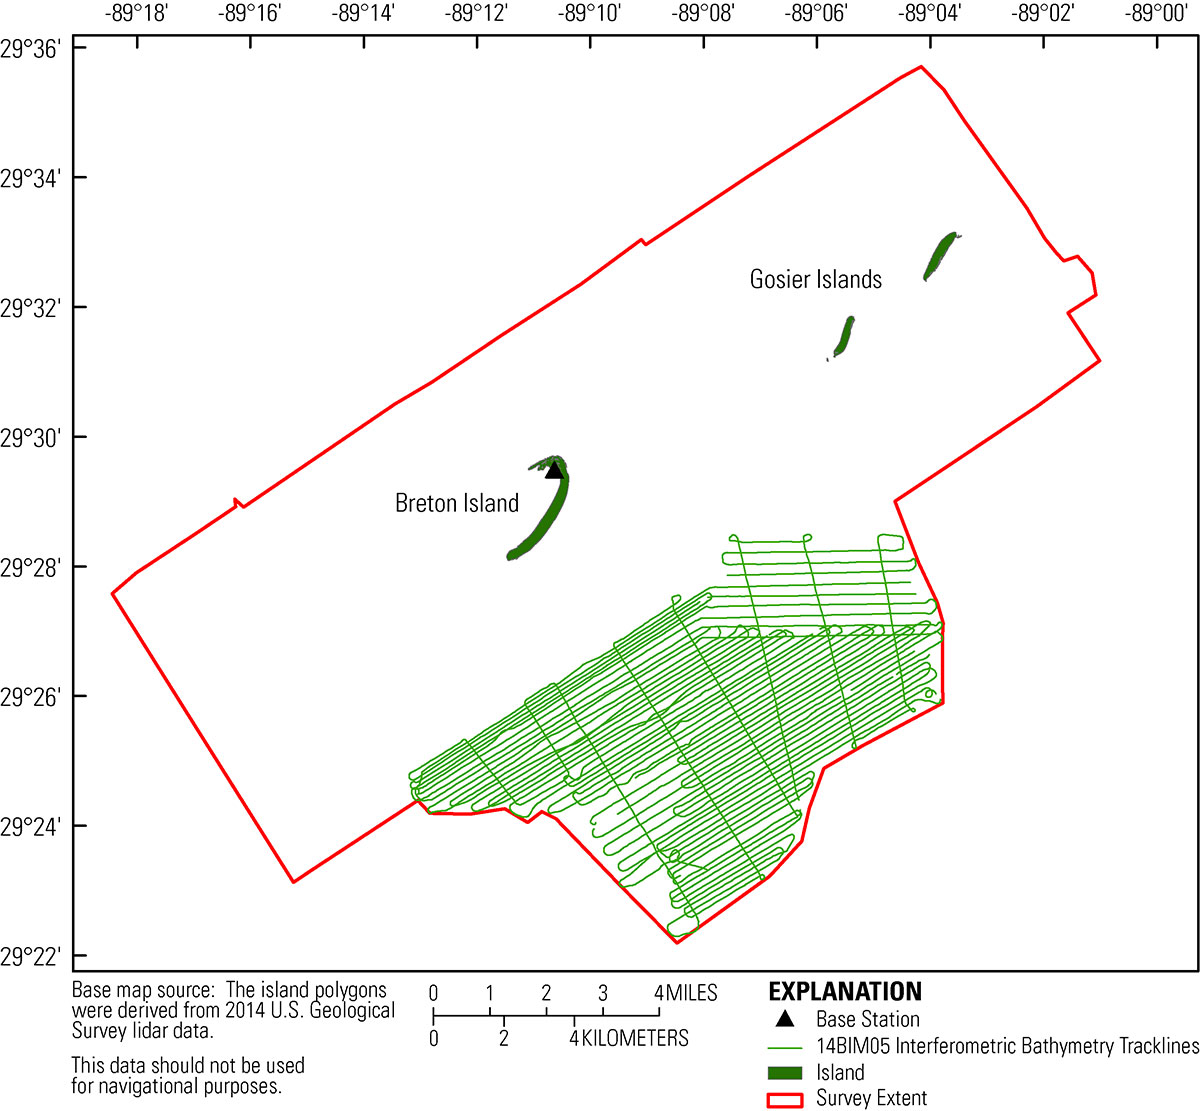
Figure 14. Trackline map of the R/V Tommy Munro showing the 565 line-kilometers (89 lines) of interferometric swath, side-scan sonar, and a high-resolution chirp subbottom data collection. Island polygon is derived from 2014 U.S. Geological Survey lidar. [Click to enlarge] |
|