Data Series 1005
| Data ProcessingSingle-Beam BathymetryNavigationThe coordinate values for each of the GPS base stations (BRET and BRT2) are the time-weighted average of values obtained from the National Geodetic Survey’s (NGS) On-Line Positioning User Service (OPUS). The base station coordinates were imported into GrafNav version 8.5 (Waypoint Product Group) and the kinematic GPS data from the survey vessel were post-processed to the concurrent GPS data from the base stations. In all cases, the closest base station to the roving vessel was used to keep vertical error to a minimum. During processing, steps were taken to ensure that the trajectories between the base and rover were clean and resulted in fixed positions. By analyzing the graphs, trajectory maps, and processing logs that GrafNav produces for each GPS session, GPS data from satellites that were flagged by the program as having poor health or satellite time-segments with cycle slips could be excluded, or the satellite elevation mask angle could be adjusted to improve the position solutions. The final, differentially corrected, precise DGPS positions were computed at their respective intervals (1 s for 14BIM02 and 0.10 s for 14BIM03) and then exported in American Standard Code for Information Interchange (ASCII) text format, which replaced the uncorrected real-time rover positions recorded during acquisition. The GPS data were processed and exported in World Geodetic System of 1984 (WGS84) (G1150) geodetic datum. Soundings and MotionThe raw HYPACK data files (version 14.0.9.47 for 14BIM02 and version 13.0.09.17 for 14BIM03) were imported into CARIS HIPS and SIPS version 8.1.7. The corrected DGPS positions exported from GrafNav were imported into CARIS using the generic data-parser tool within CARIS. After parsing, the navigation data were scanned using the Navigation Editor within CARIS, allowing the user to view multiple types of plots, including trackline orientation, timing, and course direction. This check verifies that the parsed data correspond to the processed DGPS. Next, SVP profile casts were entered and edited using the SVP editor tool within CARIS. All bathymetric data components—position, motion, depth, and SOS—were then merged and geometrically corrected with CARIS to produce processed x,y,z data. Once merged, the dataset is reviewed for erroneous points using the Single Beam Editor. These points are visually obvious and often related to cavitation in the water column obscuring the fathometer signal, tight turns in the surf zone that can affect the tracking of incoming GPS signals, and false readings due to general equipment issues. Data points in areas of extremely shallow water (0.30m–0.50m), as with shoals and seagrass beds, are reviewed against the surrounding data for coherency. Finally, a Bathymetry with Associated Statistical Error (BASE) surface is created. Using the CARIS Subset Editor, the BASE surface is used as a color-coded guide to pinpoint crossings visually offset from one another. If an offset is identified, it is further examined for rationale and reprocessed if necessary. The geometrically-corrected point data were then exported as an x,y,z ASCII text file referenced to WGS84 (G1150) and ellipsoid height in meters. The combined single-beam bathymetry datasets (14BIM02 and 14 BIM03) consists of 8,151,730 x,y,z data points with an ellipsoidal elevation range of -36.531 m to -27.419 m. Using the National Oceanic and Atmospheric Association (NOAA) transformation software, VDatum version 3.2, the data were converted horizontally and vertically into the North American Datum of 1983 (NAD83) (CORS96) and the North American Vertical Datum 1988 (NAVD88) (orthometric height) using the NGS geoid model of 2009 (GEOID09). Swath BathymetryNavigation and MotionPosition data recorded by the Coda-Octopus F190R IMU system were corrected in real time using the Marinestar HP differential navigation service from Fugro. The IMU also applied real-time motion corrections for heave, roll, and pitch to the vertical component of each position fix. The corrected positions were integrated with the observed bathymetric values to calculate a final position and ellipsoid height representing the elevation of the seafloor with respect to the geodetic reference frame ITRF2005 (ITRF05) across the swath range. SoundingsAll processed data files (.sxp) were imported into CARIS HIPS and SIPS version 8.1. Outliers for the navigation data and processed soundings were removed using program filters. An editor manually identified and removed remaining outliers through visual interpretation of the dataset. A CARIS Bathymetry with Associated Statistical Error (BASE) surface with associated Combined Uncertainty and Bathymetry Estimator (CUBE) sample surface was created from the edited soundings. A CUBE hypothesis is the estimated value of a grid node, representative of all soundings within a chosen resolution or grid-cell size (for example, 5 m), weighted by uncertainty and proximity, resulting in a final value as a “sample” of the data within the specific grid cell. This algorithm allows multiple grid-node hypotheses to be verified or overridden by the user while maximizing processing efficiency. A 5-m resolution CUBE surface was created to perform initial hypothesis editing using the CARIS Subset Editor tool, followed by higher resolution surface detail editing within the subset editor. The sample x,y,z data were exported as ASCII text at a 5-m by 5-m sample resolution along tracklines in the ellipsoid datum of ITRF05. The data were then transformed into NAD83 and NAVD88 (GEOID09) using VDatum version 3.2. Side-Scan SonarThe Klein 3900 raw data files (.sdf) files were processed using CleanSweep version 3.6.1 processing software. Processing steps included bottom tracking and applying angle-varying gain to normalize the across-track backscatter amplitude. The raw navigation (GPS antenna position) and motion data were reviewed and cleaned of any errors resulting from noise. The side-scan sonar was towed behind the vessel, thus a layback and offset from the GPS antenna were applied to the georeferenced mosaic output. The Klein side-scan sonar displayed unexplained variation in the recording gain levels that necessitated modification of the look-up-tables for many swaths of data to balance the final image intensity. Some mismatch on the backscatter intensity is evident in the final mosaic. However, the patterns of backscatter intensity variation are still meaningful and usable. The final backscatter mosaic was output to a GeoTIFF at 0.30-m pixel resolution and tiled into sixteen sections to provide reasonable file sizes. The GeoTIFF imagery is presented as gray scale with low backscatter as darker shades (fig. 7). 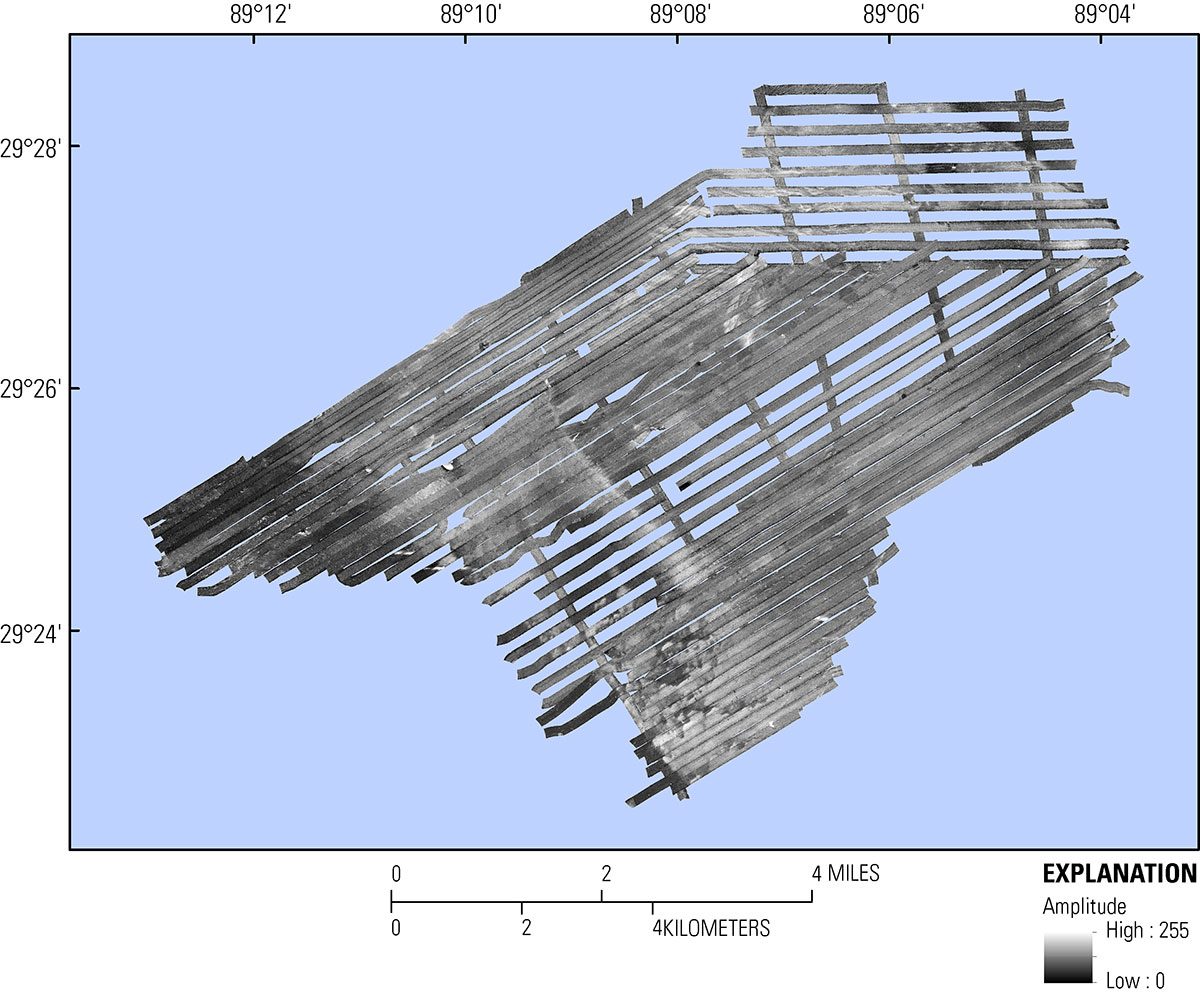 Figure 7. Side-scan sonar acoustic backscatter from the Klein 3900. [Click to enlarge] Digital Elevation ModelA digital elevation model (DEM) was created using the soundings from the individual platforms (R/V Sallenger IFB, R/V Tommy Munro IFB, R/V Jabba Jaw SBB, R/V Chum Bucket SBB, and lidar). A running mean of 2 m was applied to each dataset using the Generic Mapping Tools (GMT) version 4.5 blockmean filter to avoid aliasing short wavelengths (Lang, 2013). Since the shallow water data collected by the jet skis overlapped the water-depth measurements from the topobathy lidar survey, the two data files were merged, and a blockmean filter was applied to the merged data. The data were first sorted by geographic position so that the blockmean filter would prioritize by position rather than acquisition platform. Statistics for the datasets are listed by platform in Table 10.
Table 10. Bathymetric dataset statistics of each survey platform used to create the Breton 2014 Digital Elevation Model (DEM). Statistics include number of sounding samples, x (easting), y (northing), and z, (measured depth).
The resulting data file was gridded to 100-m grid cells using the GMT Tools surface algorithm and a search radius of 200 m to initialize the grid; a tension filter of 0.03 was used to suppress spurious oscillations. A grid mask generated from a polygon digitized around the survey area was applied to the resulting grid to exclude areas without data using the GMT Tools grdmask and grdmath functions. The grid file in Network Common Data Form (NetCDF) was converted to a raster using Esri’s ArcMap version 10.2.2 Multidimension Tool Make NetCDF Raster Layer and exported as a GeoTIFF. Additionally, the DEM was converted into a point file using Esri’s raster-to-point conversion tool, and the easting and northing positions were populated using XTools Pro version 11.1. The elevation range for the 2014 Breton Island DEM is from +1.53 m to -10.45 m (fig. 8 and table 11). Table 11 contains the DEM statistics, including the minimum and maximum values for easting, northing, grid nodes, and elevation. 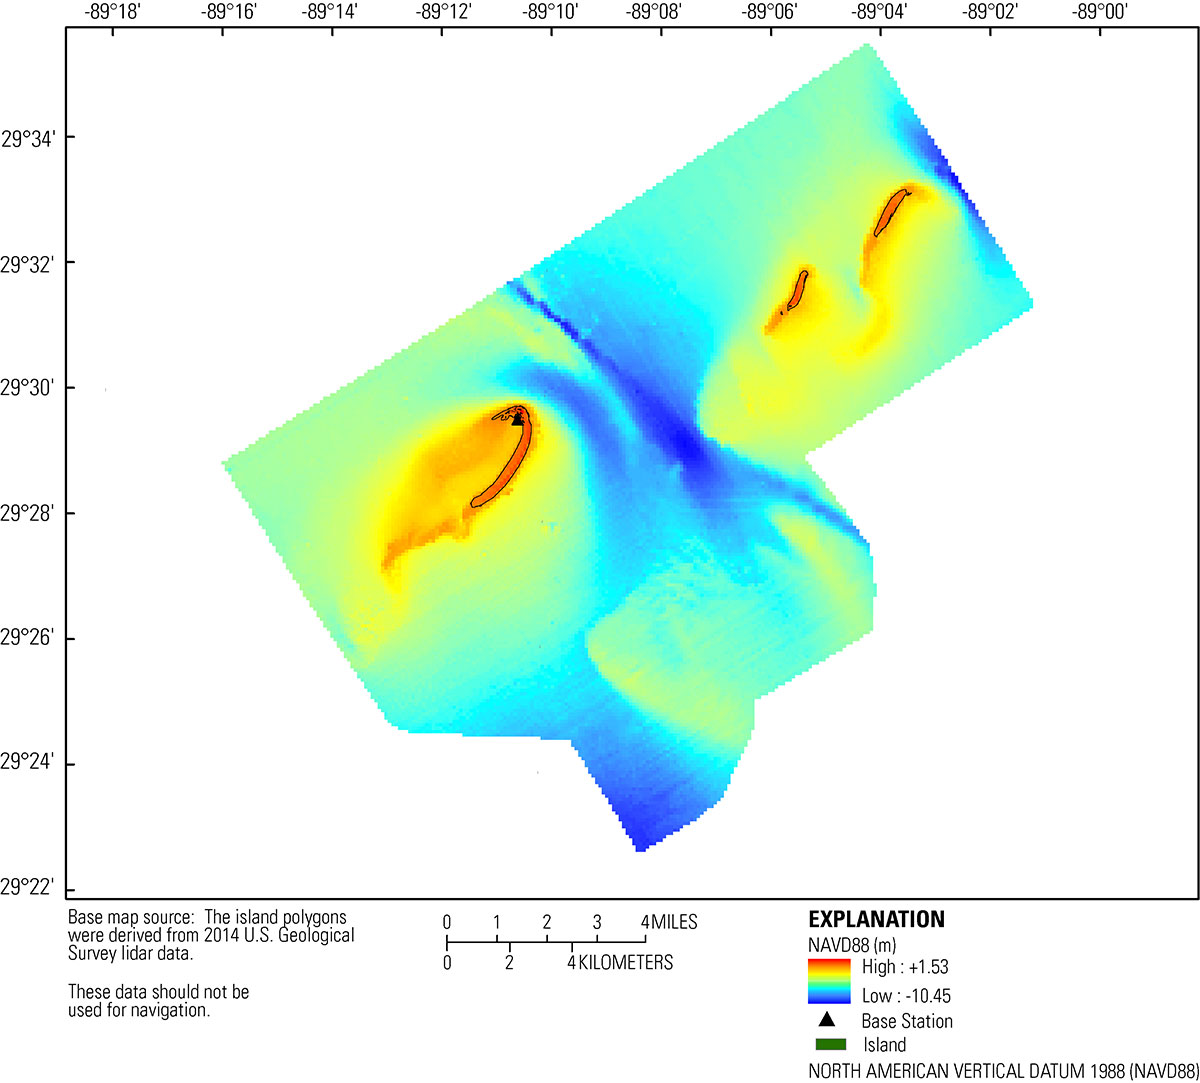 Figure 8. The 100-meter (m) Digital Elevation Model for the 2014 Barrier Island Mapping at Breton and Gosier Islands, Breton Island National Wildlife Refuge, Louisiana. Horizontal data are referenced to North American Vertical Datum of 1983 Universal Transverse Mercator (UTM) Zone 16 North, and the vertical data are referenced to North American Vertical Datum 1988 with respect to GEOID09. Island polygon is derived from 2014 U.S. Geological Survey lidar. [Click to enlarge]
Table 11. Statistics for the 100-meter Digital Elevation Model of the 2014 Barrier Island Mapping at Breton and Gosier Islands, Breton Island National Wildlife Refuge, Louisiana. Statistics include x (easting), y (northing), and z (grid node elevation). The grid contains 277 columns and 247 rows. Horizontal data are referenced to North American Vertical Datum of 1983 Universal Transverse Mercator (UTM) Zone 16 North, and the vertical data are referenced to North American Vertical Datum 1988 with respect to GEOID09.
Note: Any use of trade names is for descriptive purposes only and does not imply endorsement by the U.S. Government. | ||||||||||||||||||||||||||||||||||||||||||||||||||||||||||||||||||||||||||||||||||||

![]() U.S. Department of the Interior |
U.S. Geological Survey
U.S. Department of the Interior |
U.S. Geological Survey
URL: http://pubsdata.usgs.gov/pubs/ds/1005/ds1005-processing.html
Page Contact Information: GS Pubs Web Contact
Page Last Modified: Monday, 28-Nov-2016 20:51:12 EST
