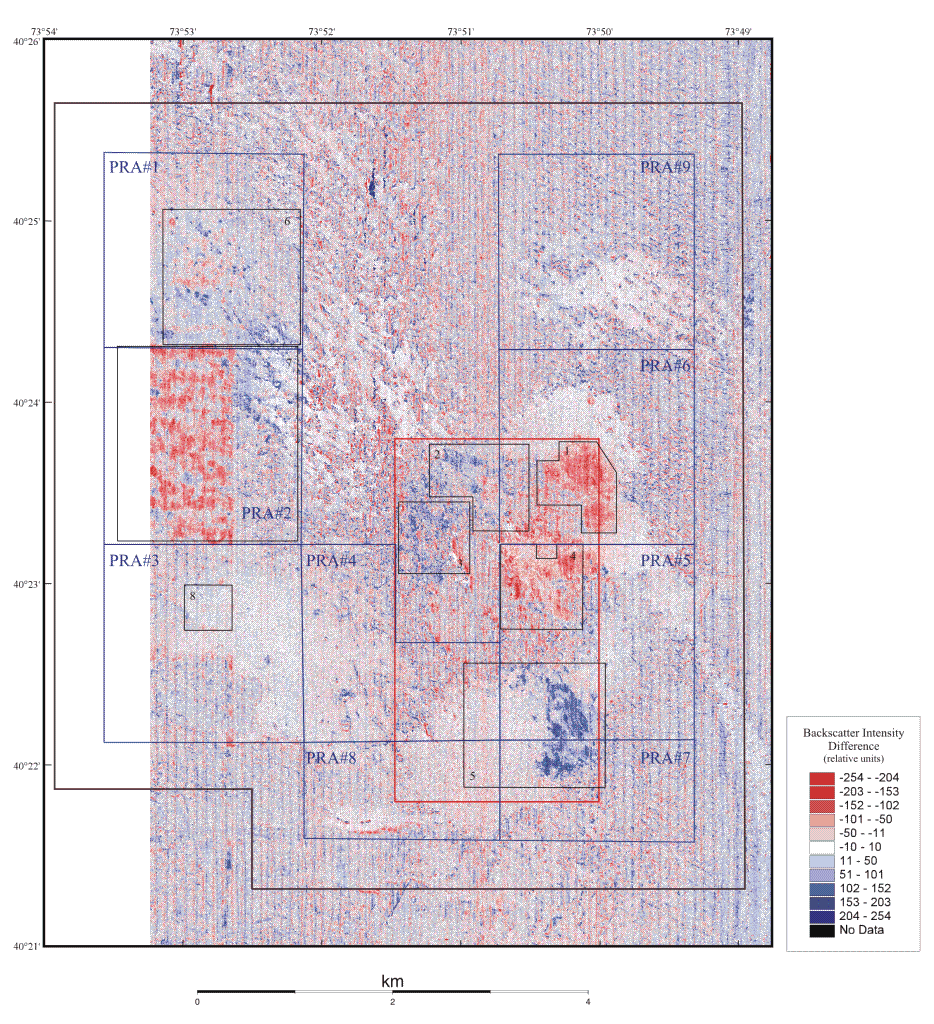
Backscatter Difference
Figure 9c. 1996-2000
Backscatter intensity observed in 2000 subtracted from 1996. Areas of reduced backscatter intensity in 2000 are shown in blue shades, areas of increased backscatter are shown in red shades. Areas of no change are shown in white. Notable increases in backscatter intensity were observed in Areas 1 and 4, and in the western part of Area 7. Notable decreases in backscatter intensity were observed in Areas 5, parts of Area 6, and in the northeastern part of Area 7. The broad areas of low backscatter intensity in the HARS region (see large areas of dark blue in figure 6b in the southwest corner centered at 40°22.5' N., 73°525' W., along the eastern margin centered at 40°24.0' N., 73°50.0 W., and along the crest of the ridge centered at 73°51.5' W.) show little change in backscatter intensity between the surveys. These are interpreted to be areas of fine-sediment accumulation where additional fine-grained sediment accumulation from distant sources would not be expected to change the backscatter intensity characteristics from year to year. The north-south stripes, running parallel to the survey tracklines, are artifacts of data collection and environmental conditions.