USGS Open-File Report 03-474, G1-03-GM, Gas Hydrates Cruise Report, R/V Gyre, 1-14 May 2003, Northern Gulf of Mexico
Title Page
Abstract
Introduction
Acknowledgments
Geologic Settings
Cruise Objectives
Cruise Strategy
Instrumentation
Data Processing
Data Handling
Marine Mammal Mitigation
OPERATIONAL SUMMARY
Success in Meeting Objectives
Summary
References
Appendices
1. Multichannel
Line Statistics
2. Summary of
Digital Data
3. Marine
Mammal
Documents
4. Science
Roster
5. Ship Roster &
Specifications
6. Photo Gallery
Operational Summary
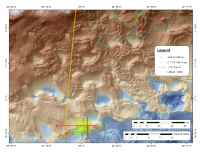
Keathley Canyon Survey Area
 |
| Figure 2. Click on figure for larger image with caption. |
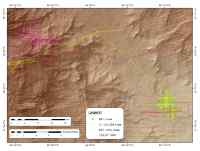
A total of 63 lines were collected in the Keathley Canyon site, excluding the three lines during which the seismic gear was tested and tuned. Lines KC1-KC59 totalled 600 km. Line KC60, which followed line LSU-B northwards out of the Keathley Canyon area to tie with the 1999 USGS multichannel data was 85 km long. Another 62 km of profiles were acquired on lines GB61-GB63 at the north end of the survey area. Line locations in the Keathley Canyon area were designed to give an overview of the region with 1-km spacings on an orthogonal east-west/north-south grid and shorter closely spaced (either 500-m or 100-m) transects over specific features of interest. The trackline map (Fig 2) shows the dense line coverage. Lines outside of the grid connected to three additional data sets: the closest well in the area for a well-seismic tie, a deep seismic reflection profile (LSU-B) that provides a regional geological overview of the continental margin (Suh, 1988), and USGS 1999 multichannel data in the Green Canyon region (Hart and others, 2002). The last two ties, (i.e, lines KC60 and GB61-GB63, along the LSU line, and to the 1999 data) were shot with the larger (24/24) GI gun configuration.
At the start of the survey, an east-west test line location was chosen to tune up the seismic systems. A possible Bottom Simulating Reflection (BSR) is observed on proprietary data along the test line location, and therefore offered a target for testing the equipment. The single channel seismics were tested first. The Huntec was towed at approximately 180-m deep, but after 4 hours had produced only minimal subbottom imaging with very low signal-to-noise ratios. Subsequent tests with the Edgetech Chirp system over 3 hours also failed to produce consistent sea floor or subbottom data. The conclusion from these tests was that neither of these systems were appropriate for the mid-slope water depths (~ 1300 m) at the Keathley Canyon 195 study region.
 |
| Figure 3. Click on figure for larger image with caption. |
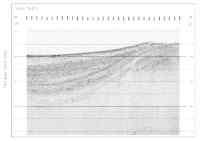
The next phase of the testing was to compare sources for the multichannel data. The 15-in3 water gun (used in the 1999 multichannel survey in Green Canyon, Hart and others, 2002) was tried first, fired at 2000 psi every 10 m (Fig. 3). The line was then reshot with the 13/13 in3 GI gun, fired at 3000 psi every 20 m (Fig. 4).
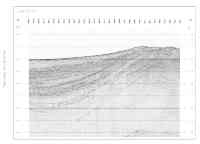 |
| Figure 4. Click on figure for larger image with caption. |
 |
| Figure 5. Click on figure for larger image with caption. |
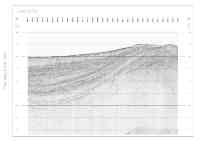
Near the end of the Keathley Canyon survey a second test of multichannel sources was run comparing the 13/13 in3 GI gun configuration with the 24/24 in3 GI gun chambers (Fig. 5). This test was to assess the trade-off between a larger chamber source (24 in3) and fewer shots (30-m shot spacing and 4-fold stacking). Subsequent processing revealed little difference between the 13-in3 and 24-in3 records, and the smaller 13-in3 chambers were reinstalled during the transit between the Keathley Canyon and Atwater Valley sites.
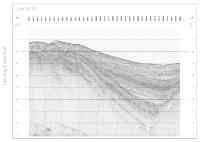 |
| Figure 6. Click on figure for larger image with caption. |
The multichannel seismic data from the Keathley Canyon area were generally of excellent quality, with penetration of the seismic signal beneath the sea floor in the basins in excess of 1 s two-way travel time (twtt) and penetration beneath the sea floor on the highs adjacent to the basins about .5 - .8 s twtt. Line KC9 is an excellent example of data quality for the Keathley Canyon lines (Fig. 6). The record illustrates a rich pattern of unconformities, pinch-outs, on-laps, and faults between the basin center and structural high at the edge of the basin. In addition, the record shows abundant diffractions at the sea floor and within the reflecting units, and numerous amplitude variations. A crosscutting event at CDP 2042 and 2.6 s twtt may be a segment of a BSR.
 |
| Figure 7. Click on figure for larger image with caption. |
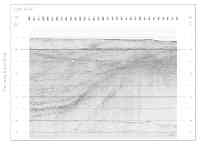
Knudsen bathymetric data quality in the Keathley Canyon area was weather dependent. For the first part of the survey, when weather was calm, subbottom reflections were strong and penetration of the signal beneath the sea floor was excellent, often greater than 40 m and sometimes reaching as much as 80 m (Fig. 7). However, by line KC6, the swell was picking up with a strong southerly air flow (>20 kts), and the bathymetry signal deteriorated. By line KC9, and through the rest of the Keathley survey, the signal was weak and erratic on lines going with the seas, and essentially non-existent on lines into or cross-wise with the 2-3 m (6-10 ft) seas.
Atwater Valley Survey Area
 |
| Figure 8. Click on figure for larger image with caption. |
A total of 253 km of MCS data along 35 short lines were collected during the survey in the Atwater Valley 14 lease block (Fig. 8). Profiling was designed around detailed north-south and east-west surveys (5 km long lines each 100 m apart) of each of the three vent/mound sites identified by the JIP as hydrate targets. A shorter grid of lines spaced more widely to give the geologic setting were rotated approximately 45o from north-south to be more orthogonal to the seas created by the strong southeast winds at the start of the survey and to connect profiles between vents/mounds. The winds gradually died to zero during the three days of profiling so that the final lines shot (in the east-west orientation) were among the best for data quality.
 |
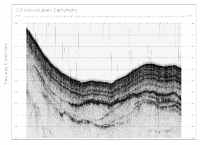
| Figure 9. Click on figure for larger image with caption. |
Line AV97 (Fig. 9) shows an example of the stacked MCS data collected across the center of one of the three mound/vent sites. Data quality is excellent. Among the features visible on the record section are abundant sea floor diffractions, discontinuous reflections, zones of very strong amplitudes, zones of wash outs, and possible pull-downs beneath the vent/mound sites. Seismic stratigraphy is complicated with many unconformable shallow reflections and multiple dipping reflections (on the east side of the section). The dipping reflections show good signal penetration to greater than 1 s twtt. The strength of these dipping reflections at these depths suggests that the absence of reflections at similar depths in other parts of the record (e.g., beneath the vent/mounds) is due to attenuation of the signal or the disruption of the sedimentary section.
Lines AV99, MC100 and MC101 connected the Atwater Valley lines up the axis of the Mississippi Canyon to two Marion Dufresne core sites collected by USGS in 2002 (sites 2569 and 2570, Lorenson and others, 2002). These lines also crossed the 1998 USGS MCS data around these core sites, providing a seismic-line tie.
Knudsen data quality in Atwater Valley, as in the Keathley Canyon region, was dependent on the weather. As the winds and seas moderated during the time spent at the Atwater site, the quality of the bathymetric record improved. In general, the bottom return was strong with few subbottom reflections, suggesting a harder, more reflective sea floor than in Keathley Canyon. The long line collected northwestward along the axis of the Mississippi Canyon crossed regions of varying sea floor returns, including many layered units within the subbottom, showing the variations in bottom type within the floor of the Canyon.
