|
|
By Scott T. Prinos |
|

|
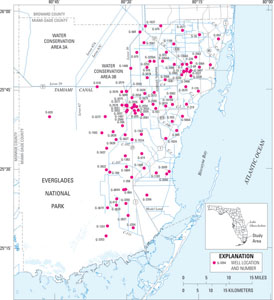
INTRODUCTIONThe U.S. Geological Survey (USGS) ground-water level monitoring network in southern Florida began in 1939 as a cooperative effort with the cities of Miami, Miami Beach, and Coral Gables and with Dade County (later renamed Miami-Dade County) to evaluate the effect of a drought on the ground-water supplies in this area (Meinzer and others, 1940). Between 1939 and 2001, the network was expanded to include wells in 10 counties and 3 aquifer systems (which are subdivided into locally named aquifers at some locations). During this period, the hydrology of southern Florida was influenced by urban development and increased management of the hydrologic system. As these changes occurred, the existing network coverage had to be continually modified and redesigned to: (1) aid in the management of the complex hydrologic management system in southern Florida; (2) assess natural and anthropogenic changes affecting the aquifers to protect municipal water supplies; (3) assess water levels in agricultural and urban areas; (4) help eliminate undesirable effects on the delicate ecological system in this area, particularly during droughts; and (5) provide the spatial coverage necessary to produce regional semiannual water-level contour maps, which were used for urban planning. To provide the coverage necessary to meet the above-mentioned criteria, the network expanded from 4 to 1,020 wells during the 1939-95 period. Ground-water monitoring networks of this size, however, are both difficult and costly to operate. It may be necessary to collect data for decades before changes and trends in the aquifer become evident. Continually monitoring the same wells over a period of decades is a challenge, particularly in urban areas where construction projects often destroy monitoring wells. Sometimes these wells cannot be replaced despite increased efforts. For this and additional reasons, the commitment to cooperatively support collection, computation, quality assurance, publication, and long-term data storage from a network of this size and complexity, through a period that spans many decades can be substantial. Between 1996 and 2000, the USGS discontinued data collection at many of the wells in its ground-water monitoring network in southern Florida. By 2000, slightly less than half (499 wells) of the 1995 cooperative ground-water monitoring network remained. Most of the wells that were discontinued were measured at a monthly, quarterly, or semiannual frequency. Discontinued wells included most of those that had been needed to produce the regional water-table contour maps. During the 2000-01 drought (Abtew and others, 2003), some wells were added or reinstated to help fill apparent gaps in network coverage, but other wells were discontinued because they were damaged or destroyed. In 2001, there were 518 wells in the network. The most highly concentrated portion of the current USGS cooperative network occurs in Miami-Dade County in the Biscayne aquifer where 146 wells are used to monitor water levels and aid in evaluation of saltwater encroachment. Ninety-eight of these wells are equipped with water-level recorders to provide continuous monitoring of ground-water levels (fig. 1 and table 1).
Although investigations were performed to aid in the design of Miami-Dade County's saltwater encroachment network (Klein and Waller, 1985; Klein and Ratzlaff, 1989; Sonenshein and Koszalka, 1996; Sonenshein, 1997), the design and subsequent changes to the continuous ground-water level monitoring network in the county between 1939 and 2001 were not based on countywide statistical assessments of network coverage, but instead on area specific assessments. Countywide statistical assessments could help ensure that network coverage is sufficient to fully evaluate the complex hydrologic system in this area. These statistical assessments, used in conjunction with other data and analyses, could also be used to help determine whether or not monitoring resources are overallocated. To aid in the statistical assessment of network coverage, the USGS, in cooperation with the Miami-Dade County Department of Environmental Resource Management, conducted a study to perform correlation analyses on water-level data from the 98 wells in the continuous ground-water level monitoring network in Miami-Dade County. This report documents the methods used to perform the correlation analysis of the network in Miami-Dade County. Considerations include: (1) spatial relations within the study area, (2) seasonal variation of water level in the study area, and (3) temporal changes in correlation between monitoring wells. |
| |||||||||